the accompanying table provides a probability distribution for the number of major hurricanes, Y, for a randomly selected year between 1851 and 2012. Complete parts a) through (c) below. Click the icon to view the distribution of hurricanes. a. Find and interpret the mean of the random variable. = (Round to three decimal places as needed.) 1 X Distribution of Major Hurricanes y P(Y=y) y P(Y=y) 0 0.184 5 0.051 1 0.283 0.021 2 0.245 0.011 3 0.072 0.085 4 0.048 Help me solve this View an example Get more help. Print 6 7 8 Done Clear all Check answer
the accompanying table provides a probability distribution for the number of major hurricanes, Y, for a randomly selected year between 1851 and 2012. Complete parts a) through (c) below. Click the icon to view the distribution of hurricanes. a. Find and interpret the mean of the random variable. = (Round to three decimal places as needed.) 1 X Distribution of Major Hurricanes y P(Y=y) y P(Y=y) 0 0.184 5 0.051 1 0.283 0.021 2 0.245 0.011 3 0.072 0.085 4 0.048 Help me solve this View an example Get more help. Print 6 7 8 Done Clear all Check answer

MATLAB: An Introduction with Applications
6th Edition
ISBN:9781119256830
Author:Amos Gilat
Publisher:Amos Gilat
Chapter1: Starting With Matlab
Section: Chapter Questions
Problem 1P

Related questions
Question
Transcribed Image Text:Video & Resource
Library
Accessible Resources
Purchase Options
Communication Tools
esc
1
Fő
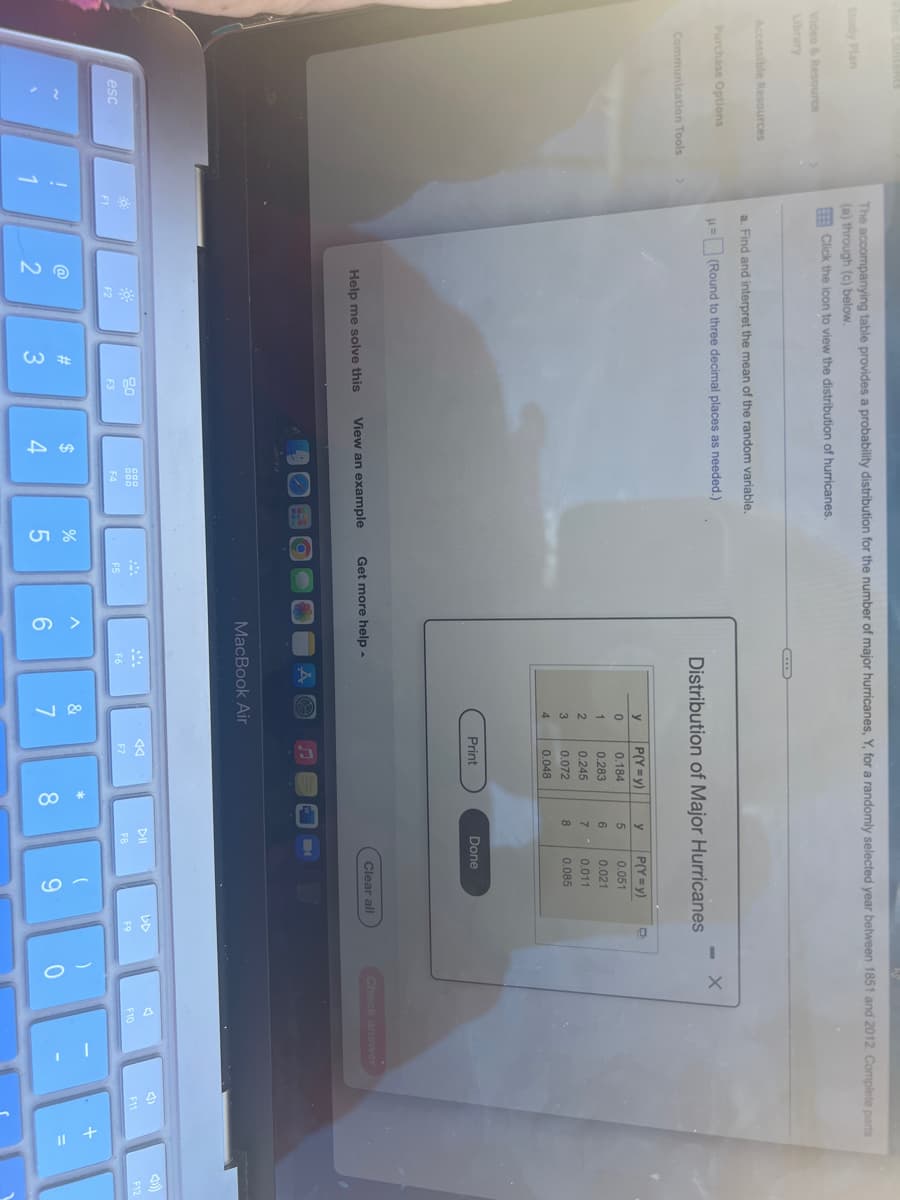
The accompanying table provides a probability distribution for the number of major hurricanes, Y, for a randomly selected year between 1851 and 2012. Complete parts
(a) through (c) below.
Click the icon to view the distribution of hurricanes.
a. Find and interpret the mean of the random variable.
= (Round to three decimal places as needed.)
X
Distribution of Major Hurricanes
P(Y=y)
y
y
D
P(Y=y)
0
0.184
5
0.051
1
0.283
0.021
2
0.245
6
7
8
0.011
0.072
0.085
0.048
Help me solve this
20
F2
F3
2
#3
View an example Get more help.
F4
$
4
%
175
F5
3
4
MacBook Air
F6
6
&
7
Print
F7
* CO
8
Done
DII
FB
Clear all
9
F9
)
0
Check answer
F10
F11
+
F12
Expert Solution
This question has been solved!
Explore an expertly crafted, step-by-step solution for a thorough understanding of key concepts.

This is a popular solution!

Trending now
This is a popular solution!

Step by step
Solved in 2 steps

Recommended textbooks for you
MATLAB: An Introduction with Applications
Statistics
ISBN:
9781119256830
Author:
Amos Gilat
Publisher:
John Wiley & Sons Inc

Probability and Statistics for Engineering and th…
Statistics
ISBN:
9781305251809
Author:
Jay L. Devore
Publisher:
Cengage Learning

Statistics for The Behavioral Sciences (MindTap C…
Statistics
ISBN:
9781305504912
Author:
Frederick J Gravetter, Larry B. Wallnau
Publisher:
Cengage Learning
MATLAB: An Introduction with Applications
Statistics
ISBN:
9781119256830
Author:
Amos Gilat
Publisher:
John Wiley & Sons Inc
Probability and Statistics for Engineering and th…
Statistics
ISBN:
9781305251809
Author:
Jay L. Devore
Publisher:
Cengage Learning
Statistics for The Behavioral Sciences (MindTap C…
Statistics
ISBN:
9781305504912
Author:
Frederick J Gravetter, Larry B. Wallnau
Publisher:
Cengage Learning

Elementary Statistics: Picturing the World (7th E…
Statistics
ISBN:
9780134683416
Author:
Ron Larson, Betsy Farber
Publisher:
PEARSON

The Basic Practice of Statistics
Statistics
ISBN:
9781319042578
Author:
David S. Moore, William I. Notz, Michael A. Fligner
Publisher:
W. H. Freeman

Introduction to the Practice of Statistics
Statistics
ISBN:
9781319013387
Author:
David S. Moore, George P. McCabe, Bruce A. Craig
Publisher:
W. H. Freeman