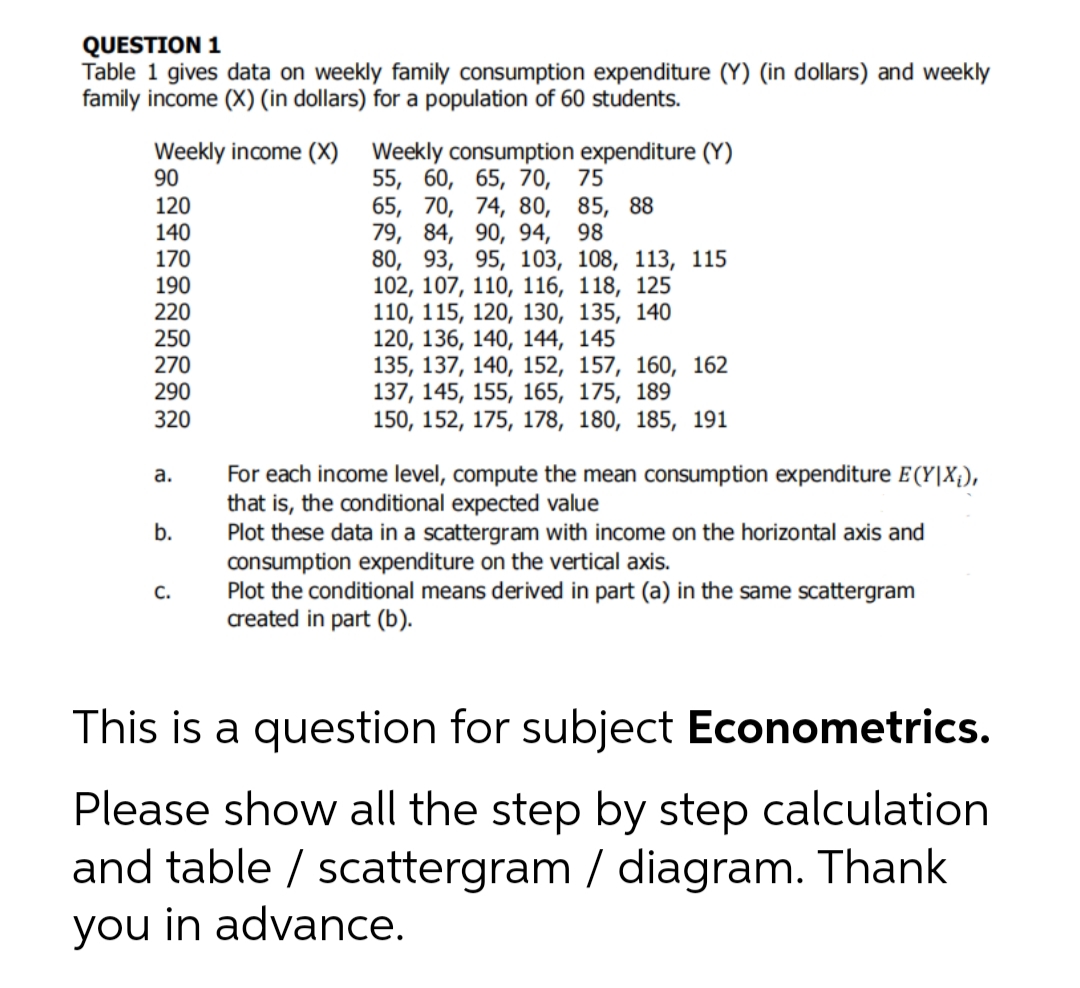
QUESTION 1 Table 1 gives data on weekly family consumption expenditure (Y) (in dollars) and weekly family income (X) (in dollars) for a population of 60 students. Weekly income (X) 90 120 140 170 190 220 Weekly consumption expenditure (Y) 55, 60, 65, 70, 75 65, 70, 74, 80, 85, 88 79, 84, 90, 94, 98 80, 93, 95, 103, 108, 113, 115 102, 107, 110, 116, 118, 125 110, 115, 120, 130, 135, 140 120, 136, 140, 144, 145 250
Q: Question Five: You are given the following data for output at a company and costs of production…
A: Solution: Let X= Output (000 units ) and Y = Production cost ( $000) To fit the regression…
Q: Rework problem 15 in section 2 of Chapter 5 of your textbook about the growing suburb and the…
A: Given that, the suburb has a population of 688000 and is growing at a rate of 7000 per year. The…
Q: Question 2 Harmie's average monthly electricity usage is 975 kWh. Using a 30 day month, what is her…
A: We can answer this question as below
Q: The data of advertisement expenditure (X) and sales (Y) of a company for 10 years is shown in the…
A: To determine the correlation coefficient, we use its formula shown below.
Q: ZIMS store sells its products on installments in Karachi. The store decided to investigate the link…
A: To create scatter plot we can use excel so it would be easy to find all such parameters. In excel…
Q: Question 10 The box plots show the heights of boys and girls in Mrs. Causey's class. Boys Girls ++++…
A:
Q: Example 3.3 Suppose, we are given the following data pertaining to the sales of an enterprise: ('000…
A:
Q: Questions 1-5 refer to the small group of data shown below. X Y 4 3 2 2 0 7 4 5 6 2…
A:
Q: QUESTION 1 Antonio's is thinking of increasing the base price of their pizzas as follows: Size of…
A: Relative change in price of small pizza = (7.50 - 6.00)/6.00 = 0.25 Relative…
Q: QUESTION 10 "A researcher wants to explore the relationship between sugar intake and overall…
A: Instruction : "10" 10) Independent variable is the variable which is changed or manipulated in a…
Q: Question Two It can be said that some professions/jobs come with more stress. This stress is…
A: Since you have posted a question with multiple sub-parts, we will solve first three sub-parts for…
Q: The graph below shows the value of Bob's Funko Pop collection over several ye 3000x 2800 2600 2400…
A:
Q: Question 2 The following table contains yearly data on the price of chicken from 2019 to 2021: Price…
A: 1. Using the three year moving average method, the forecast for price in 2022 will be the average…
Q: Question 8 Find the coefficient of variation of the data set: 1.8, 2.1, 1.7, 1.6, 0.9, 2.7, 1.8 30
A:
Q: Energy consumption is claimed to be a good predictor of Gross National Product. An economist…
A: The data shows the energy consumption (x) and gross national product (y).
Q: Questions 6-9. Consider the data in the table. Time Value Absolute Change Relative Change Percent…
A: Consider the data in the given table. Use the following formulas to complete the table. Absolute…
Q: Question 1 With the growth of internet service providers, a researcher decides to examine whether…
A: Note: According to Bartleby expert guidelines, expert can answer only first question with their…
Q: Classify data as discrete or continuous? a) Ages of students at Elementary School. b) Number of…
A: Classify data as discrete or continuous? (a) Ages of students at Elementary School. (b) Number of…
Q: Use an appropriate graphical technique or chart to compare the number of enrolment in 2018 and 2019…
A: Given that,
Q: Question 6 The following table shows retail sales in drug stores in billions of dollars in the U.S.…
A:
Q: Predict the Monthly income
A: Answer: $3.03
Q: Example 1 From the following table of yearly premium for polices maturing at different years stimate…
A:
Q: Need answers to questions 1, 2, and 3.
A: 1. Excel is used to make the scatter plot for provided data of Autism Cases verses DTP Coverage. The…
Q: Problem #1. The electric power consumed each month by a chemical plant is thought to be related to…
A: a) Step-by-step procedure to find the regression line using Excel: In Excel sheet, enter x1, x2,…
Q: ZIMS store sells its products on installments in Karachi. The store decided to investigate the link…
A: To find scatter chart we can use excel. It is the easiest way to Calculate regression equation also.…
Q: Problem 1 - $3.4 Facebook Users in Australia: The following table shows both current and projected…
A: a. Regression Equation: Excel Procedure: Enter t and F data in Excel Go to Data Click on Data…
Q: Question 1: Which or the two variables (times absent or grades on the final exam) is the independent…
A: Dependent variable: If the variable influenced by other variable then the variable is called as…
Q: Question 1 What is the variable type for the type of flooring in a room? O Qualitative Discrete O…
A: Quantitative variable are numeric on nature and divided into two categories discrete and continuous.
Q: Example 2 Following data represents productions of area of production for the nast s years.…
A:
Q: The risk of acquiring a given disease during a time period is best determined by: A. the…
A: The incidence rate is the one which is responsible for measuring the risk of the disease acquired…
Q: Question 3 The following ACF plots were produced for raw data of monthly sales of two different…
A:
Q: Question 5 Identify whether the below data for the given variable would be discrete or continuous.…
A: The variable are given and objective is to find the if they are discrete or continuous.
Q: The relationship between annual salary (in US dollars) and race was estimated as below in a linear…
A: Here given the estimated relationship between annual salary (in US dollars) and race in a linear…
Q: Using one example each of an application of statistics in four disciplines (Medicine, Engineering,…
A: Application of Statistics in Medicine, Engineering, Economics .
Q: Question 15 Demand Refer to the figure above or click here e to open the same image in Flickr if…
A: Note: We are entitled to solve only one question at a time. As the specified one is not mentioned,…
Q: Question 3 The following ACF plots were produced for raw data of monthly sales of two different…
A: Answer 3: a) Here Variable A is most likely easier to forecast then the other varibales . It is…
Q: QUESTION 10 "A researcher wants to explore the relationship between sugar intake and overall…
A: Dear student as per guidelines we solve only first question when multiple different questions are…
Q: Question No. 1: ZIMS store sells its products on installments in Karachi. The store decided to…
A: a) To plot a scatter chart, we use Excel as follows: Enter the data into Excel and select it Go to…
Q: Exhibit 2-1The numbers of hours worked (per week) by 400 statistics students are shown below.…
A: Obtain the cumulative relative frequency for the class of 20 ≤ x< 30. The cumulative relative…
Q: Question 5 The box-and-whisker plot below represents the ages of 12 people. What percent of these…
A: 85 is the answer
Q: Questions 1-5 refer to the small group of data shown below. X Y 4 3 2 2 0 7 4 5 6 2…
A:
Q: a) A wedding photographer has made $500 on average in the 5 years it has been operational. When 12…
A: Hello. Since your question has multiple sub-parts, we will solve first three sub-parts for you. If…
Q: QUESTION II The fashion brand Luis Buittou's iconic product is its ochre scarf. It has also been…
A:
Q: The table below shows the average fuel consumption when driving at a constant speed for the British…
A: Given data : Speed and fuel used We have to tell relationship ( weak or strong) by correlation And…
Q: Example 1 The following table represents No. of deaths due to earth quake for ito years. Years: 1997…
A:
Q: Problem 1 The following data recaps the number of portions of each menu item sold on Friday evening…
A:
Q: True or False?
A: It is related to vital statistics . It is related to morbidity .
Q: True or False?
A: It is related to mortality . It is widely used in statistics .
Q: Question 10: The following is a table of the ages, in months, (X) of 7 infants and the number of…
A: Correlation : The correlation co-efficient is given by where, = correlation coefficient = values…
Trending now
This is a popular solution!
Step by step
Solved in 3 steps with 3 images
- What does the y -intercept on the graph of a logistic equation correspond to for a population modeled by that equation?QUESTION 1 According to the Insurance Information Institute, Javelin Strategy & Research, found that $16 billion was stolen from 15.4 million U.S. consumers in 2016. Assuming each person is stolen from once, what is the average amount of the thefts? If all the thefts were spread out evenly over the year, how frequently would a theft occur?Question 9b . Describe the relationship displayed in the scatterplot (Using DUFS)
- QUESTION 7 True or False? The incidence rate of a disease is defined as the number of new cases of the disease over a time period divided by the total population (at risk) during the same time period times a multiplier (e.g. 100,000).Problem 20- psych stats show full workQuestion 1 (10.2) Mark the mean of the dataset, the first principal component, and the second principal component. You don't have to calculate anything; just make approximate markings.
- Question 4: According to the data, which team(s) had the highest fourth down conversion rate during the 2021-2022 seasons and which team(s) had the lowest? Question 5: What does the data tell us about ‘Going for it on Fourth’ in the NFL? Using what we discussed in class, provide some insight on what you’re seeing in the data.Question 6 Statistics for CSQuestion D. Give a 95% interval estimate of the number of fatal accidents per 1000 licenses in a city where 15% of the licensed drivers are under 21. Same data set as above.
- Question (c) Compute cumulative frequencies and cumulative relative frequencies.(d) What is the percentage of days when more than 6 books were stolen?Question 4 Beachcomber Ltd in a local car dealership that sells used and new vehicles. The manager of the company wants to know how different variables affect the sales of his vehicles. A random sample ofyearly data was taken with the view to testing the model:SALES=?+?AGE+?MIL+?ENGWhere SALES= amount that a vehicle is sold for($000’s), AGE = age of the vehicle, MIL= the totalmileage of the vehicle at the point of sale and ENG = the size of the engine. The sample of data was processed using MINITAB and the following is an extract of the output obtained: The regression equation is ***** Coef StDev t-ratio p-value Predict or constant 1.7586 0.2525 6.9648 0.0000 AGE 0.2124 0.3175 * 0.5042 MIL -0.7527 0.3586 -2.0991 ** ENG 4.8124 *** 7.7664…Question 4 Beachcomber Ltd in a local car dealership that sells used and new vehicles. The manager of the company wants to know how different variables affect the sales of his vehicles. A random sample ofyearly data was taken with the view to testing the model:SALES=?+?AGE+?MIL+?ENGWhere SALES= amount that a vehicle is sold for($000’s), AGE = age of the vehicle, MIL= the totalmileage of the vehicle at the point of sale and ENG = the size of the engine. The sample of data was processed using MINITAB and the following is an extract of the output obtained: The regression equation is ***** Coef StDev t-ratio p-value Predict or constant 1.7586 0.2525 6.9648 0.0000 AGE 0.2124 0.3175 * 0.5042 MIL -0.7527 0.3586 -2.0991 ** ENG 4.8124 *** 7.7664…