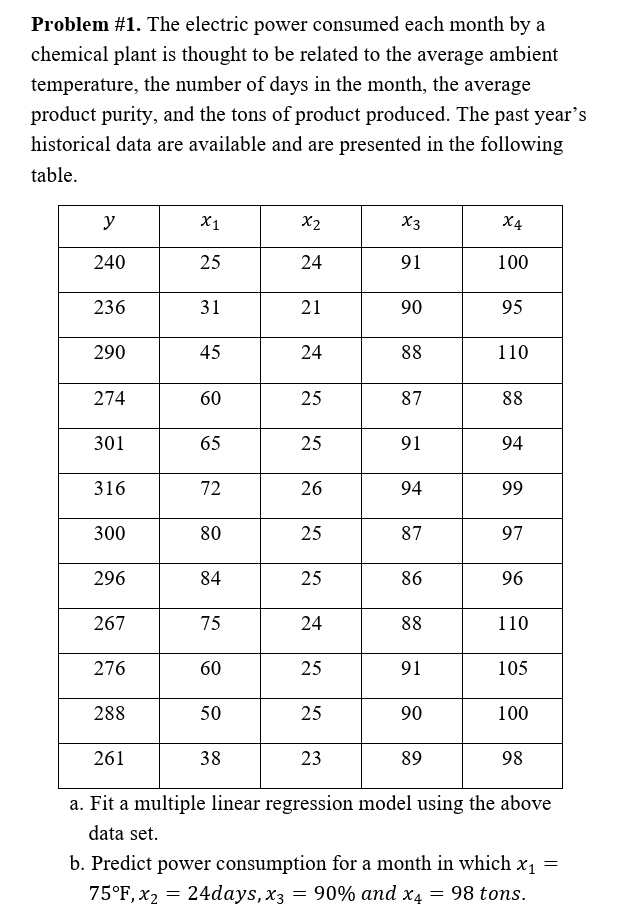
Problem #1. The electric power consumed each month by a chemical plant is thought to be related to the average ambient temperature, the number of days in the month, the average product purity, and the tons of product produced. The past year's historical data are available and are presented in the following table. y X1 X2 X3 X4 240 25 24 91 100 236 31 21 90 95 290 45 24 88 110 274 60 25 87 88 301 65 25 91 94 316 72 26 94 99 300 80 25 87 97 296 84 25 86 96 267 75 24 88 110 276 60 25 91 105 288 50 25 90 100 261 38 23 89 98 a. Fit a multiple linear regression model using the above data set. b. Predict power consumption for a month in which x1 = 75°F, x2 = 24days, x3 = 90% and x4 = 98 tons. %3D
Problem #1. The electric power consumed each month by a chemical plant is thought to be related to the average ambient temperature, the number of days in the month, the average product purity, and the tons of product produced. The past year's historical data are available and are presented in the following table. y X1 X2 X3 X4 240 25 24 91 100 236 31 21 90 95 290 45 24 88 110 274 60 25 87 88 301 65 25 91 94 316 72 26 94 99 300 80 25 87 97 296 84 25 86 96 267 75 24 88 110 276 60 25 91 105 288 50 25 90 100 261 38 23 89 98 a. Fit a multiple linear regression model using the above data set. b. Predict power consumption for a month in which x1 = 75°F, x2 = 24days, x3 = 90% and x4 = 98 tons. %3D

College Algebra
7th Edition
ISBN:9781305115545
Author:James Stewart, Lothar Redlin, Saleem Watson
Publisher:James Stewart, Lothar Redlin, Saleem Watson
Chapter1: Equations And Graphs
Section: Chapter Questions
Problem 10T: Olympic Pole Vault The graph in Figure 7 indicates that in recent years the winning Olympic men’s...

Related questions
Question
Multiple Linear Regression
Transcribed Image Text:Problem #1. The electric power consumed each month by a
chemical plant is thought to be related to the average ambient
temperature, the number of days in the month, the average
product purity, and the tons of product produced. The past year's
historical data are available and are presented in the following
table.
y
X1
X2
X3
X4
240
25
24
91
100
236
31
21
90
95
290
45
24
88
110
274
60
25
87
88
301
65
25
91
94
316
72
26
94
99
300
80
25
87
97
296
84
25
86
96
267
75
24
88
110
276
60
25
91
105
288
50
25
90
100
261
38
23
89
98
a. Fit a multiple linear regression model using the above
data set.
b. Predict power consumption for a month in which x1 =
= 90% and x4
75°F, x2 = 24days, x3
98 tons.
Expert Solution
This question has been solved!
Explore an expertly crafted, step-by-step solution for a thorough understanding of key concepts.

This is a popular solution!

Trending now
This is a popular solution!

Step by step
Solved in 2 steps with 2 images

Recommended textbooks for you
College Algebra
Algebra
ISBN:
9781305115545
Author:
James Stewart, Lothar Redlin, Saleem Watson
Publisher:
Cengage Learning

Algebra and Trigonometry (MindTap Course List)
Algebra
ISBN:
9781305071742
Author:
James Stewart, Lothar Redlin, Saleem Watson
Publisher:
Cengage Learning

Functions and Change: A Modeling Approach to Coll…
Algebra
ISBN:
9781337111348
Author:
Bruce Crauder, Benny Evans, Alan Noell
Publisher:
Cengage Learning
College Algebra
Algebra
ISBN:
9781305115545
Author:
James Stewart, Lothar Redlin, Saleem Watson
Publisher:
Cengage Learning
Algebra and Trigonometry (MindTap Course List)
Algebra
ISBN:
9781305071742
Author:
James Stewart, Lothar Redlin, Saleem Watson
Publisher:
Cengage Learning
Functions and Change: A Modeling Approach to Coll…
Algebra
ISBN:
9781337111348
Author:
Bruce Crauder, Benny Evans, Alan Noell
Publisher:
Cengage Learning