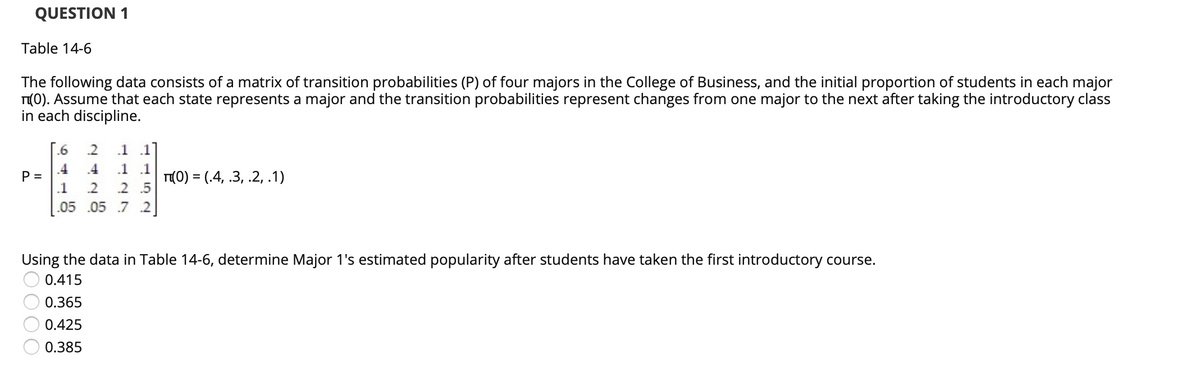
QUESTION 1 Table 14-6 The following data consists of a matrix of transition probabilities (P) of four majors in the College of Business, and the initial proportion of students in each major r(0). Assume that each state represents a major and the transition probabilities represent changes from one major to the next after taking the introductory class in each discipline. [.6 2 .1 .1 .4 .4 .1.1 P = .1 T(0) = (.4, .3, .2, .1) .2 .5 .05 .05 .7 2 Using the data in Table 14-6, determine Major 1's estimated popularity after students have taken the first introductory course. 0.415 0.365 0.425 0.385 DO00


Contingency Table
A contingency table can be defined as the visual representation of the relationship between two or more categorical variables that can be evaluated and registered. It is a categorical version of the scatterplot, which is used to investigate the linear relationship between two variables. A contingency table is indeed a type of frequency distribution table that displays two variables at the same time.
Binomial Distribution
Binomial is an algebraic expression of the sum or the difference of two terms. Before knowing about binomial distribution, we must know about the binomial theorem.
Please slove
Given information:
The transition probability matrix of of four majors is:
The initial proportion of students in each major is as follows:

Trending now
This is a popular solution!

Step by step
Solved in 2 steps


