Question 5 Suppose you are thinking about investing in three stocks, X. Y and Z You consider three possibie future states of the world: A high growth expansion (Boom), a moderate growth expansion (normal), and a mild contraction (Recession). You are not yet ready to estimate returns in each state of the economy, but you are able to state whether realised returns are equal to, higher than. or lower than expected returns. With this information what can we say about the correlation and covariance of these assets? Scenario Stock X Stock Y Stock Z Recession Ss. IZ.Recession) Normal Nar Erxl YNu= Elryl Boom SSr.X.Boom) = Elryl FZom > Elrzl L The covariance between stocks X and Y is zero. I. The covariance between stocks X and Z is negative I. The covariance between stocks Y and Z is positive. O l only Ol and only I and i only
Question 5 Suppose you are thinking about investing in three stocks, X. Y and Z You consider three possibie future states of the world: A high growth expansion (Boom), a moderate growth expansion (normal), and a mild contraction (Recession). You are not yet ready to estimate returns in each state of the economy, but you are able to state whether realised returns are equal to, higher than. or lower than expected returns. With this information what can we say about the correlation and covariance of these assets? Scenario Stock X Stock Y Stock Z Recession Ss. IZ.Recession) Normal Nar Erxl YNu= Elryl Boom SSr.X.Boom) = Elryl FZom > Elrzl L The covariance between stocks X and Y is zero. I. The covariance between stocks X and Z is negative I. The covariance between stocks Y and Z is positive. O l only Ol and only I and i only

Algebra & Trigonometry with Analytic Geometry
13th Edition
ISBN:9781133382119
Author:Swokowski
Publisher:Swokowski
Chapter10: Sequences, Series, And Probability
Section10.2: Arithmetic Sequences
Problem 67E

Related questions

Concept explainers
Contingency Table
A contingency table can be defined as the visual representation of the relationship between two or more categorical variables that can be evaluated and registered. It is a categorical version of the scatterplot, which is used to investigate the linear relationship between two variables. A contingency table is indeed a type of frequency distribution table that displays two variables at the same time.
Binomial Distribution
Binomial is an algebraic expression of the sum or the difference of two terms. Before knowing about binomial distribution, we must know about the binomial theorem.
Topic Video
Question
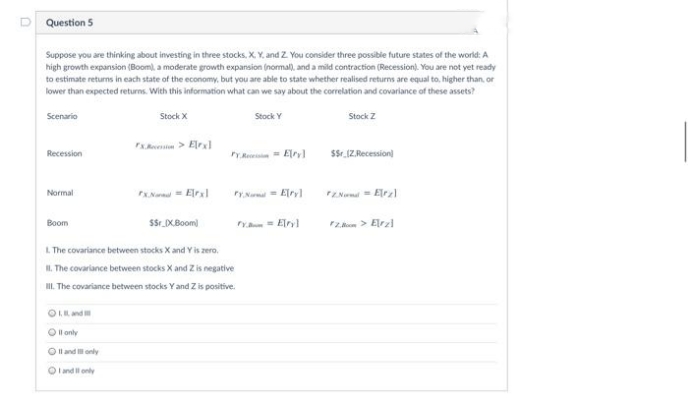
Transcribed Image Text:Question 5
Suppose you are thinking about investing in three stocks, X Y, and Z You consider three possibie future states of the world: A
high growth expansion (Boom), a moderate growth expansion (normal), and a mild contraction (Recession). You are not yet ready
to estimate returns in each state of the economy, but you are able to state whether realised returns are equal to, higher than, or
lower than expected returns. With this information what can we say about the correlation and covariance of these assets?
Scenario
Stock X
Stock Y
Stock Z
Recession
Y Re = Elryrl
r.IZ.Recession)
Normal
Nar Elrxl
YNu= Elryl
S$r. X.Boom)
Boom
= Elryl
FZm > Elrzl
L The covariance between stocks X and Y is zero,
II. The covariance between stocks X and Z is negative
I. The covariance between stocks Y and Z is positive.
Ol only
O l and only
and only
Expert Solution
This question has been solved!
Explore an expertly crafted, step-by-step solution for a thorough understanding of key concepts.

Step by step
Solved in 2 steps

Knowledge Booster


Learn more about
Need a deep-dive on the concept behind this application? Look no further. Learn more about this topic, statistics and related others by exploring similar questions and additional content below.Recommended textbooks for you
Algebra & Trigonometry with Analytic Geometry
Algebra
ISBN:
9781133382119
Author:
Swokowski
Publisher:
Cengage

Elementary Linear Algebra (MindTap Course List)
Algebra
ISBN:
9781305658004
Author:
Ron Larson
Publisher:
Cengage Learning

Linear Algebra: A Modern Introduction
Algebra
ISBN:
9781285463247
Author:
David Poole
Publisher:
Cengage Learning
Algebra & Trigonometry with Analytic Geometry
Algebra
ISBN:
9781133382119
Author:
Swokowski
Publisher:
Cengage
Elementary Linear Algebra (MindTap Course List)
Algebra
ISBN:
9781305658004
Author:
Ron Larson
Publisher:
Cengage Learning
Linear Algebra: A Modern Introduction
Algebra
ISBN:
9781285463247
Author:
David Poole
Publisher:
Cengage Learning

Trigonometry (MindTap Course List)
Trigonometry
ISBN:
9781337278461
Author:
Ron Larson
Publisher:
Cengage Learning