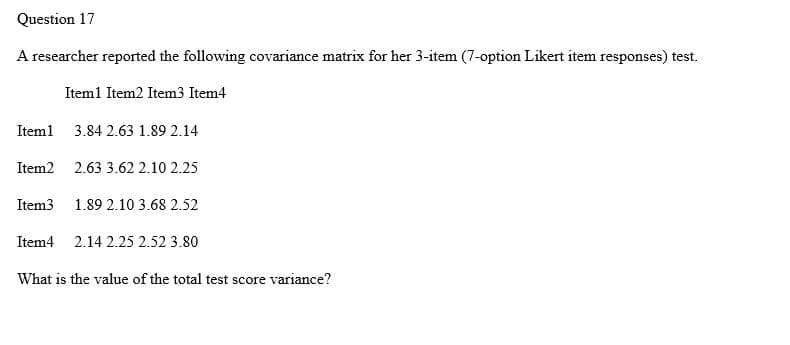
Question 17 A researcher reported the following covariance matrix for her 3-item (7-option Likert item responses) test. Item1 Item2 Item3 Item4 Item1 3.84 2.63 1.89 2.14 Item2 2.63 3.62 2.10 2.25 Item3 1.89 2.10 3.68 2.52 Item4 2.14 2.25 2.52 3.80 What is the value of the total test score variance?


Q: Refer to question (a). Find the mean of X and the variance covariance matrix of X, where X = (X1,…
A: The moment generating function(MGF) of a random variable defines the moments of a random variable.…
Q: Question 1. a) Consider an experiment which measures the value of three different vari- ables on a…
A: "Since you have asked multiple questions, we will solve the first question for you. If you want any…
Q: QUESTION 4 The number of telephone calls that arrive at a phone exchange is often modelled as a…
A: Given that Average = 6 per hour.
Q: QUESTION 3 A mail order company receives a steady supply of orders by telephone. The manager records…
A: Question 3: Given: The Poisson distribution with mean 8 orders per week. Therefore, the Poisson…
Q: Question 2: A lighting fixtures store sells four brand of LED lighting bulbs which are typically…
A: Number of total bulbs in a box = 30 The number of warm white(WW) bulb in box A = 12 The number of…
Q: Question 3: A partial tree diagram is provided. The missing probabilities are indicated by lower…
A: Given tree diagram ,
Q: QUESTION 1 A local convenience shopping centre wants to place a limit on how long customers are…
A: Given Data : Sample Size, n = 64.0 Sample Mean, x̄ = 33.0 standard…
Q: The management of a supermarket wants to adopt a new promotional policy of giving free gift to every…
A: Assume, X be the random variable representing the expenditure of customers at supermarket (in £). It…
Q: Question 8. Let X and Y be random variables with Var(X) 1, Var(Y) 3, and Var(X-Y)3D4. The…
A: Solution: From the given information,
Q: [Question 19 The common stock of DEE Bhd. has a beta of 1.24 and an actual expected return of 13.25…
A: As per CAPM ,Expected return = Risk free return + (Market return-Risk free return )*Beta…
Q: A researcher developed a 5-item (Likert style 6-option per item) test that measure a single…
A: Given:
Q: Question 7 For a particular Java assembler interface, it is known that the operand stack size has…
A:
Q: Question 16 The mumber students who enter a Library in an hour is a poisson random variable. and…
A:
Q: Question 3 The US Bureau of Labor Statistics predicts the US economy will add more than 7,371,900…
A: Given, Occupation A B C D Probability 0.234 0.128 0.134 x A : General and operations…
Q: [M] A Landsat image with three spectral components was made of Homestead Air Force Base in Florida…
A:
Q: Question 16 A researcher reported the following covariance matrix for her 3-item (7-option Likert…
A: We want to find the value of item score variance ?
Q: Review the following correlation matrix, which resulted from DVAR being regressed on VARA, VARB, and…
A: Regression analysis is often misinterpreted due to ignorance into some crucial issues.
Q: Subject Extroversion Neuroticism 1 43 49 2 46 53 3 48 67 4 48 57 5 48 56 6 50 48 7 51 60 8…
A: Let x represents the Extroversion and y represents Neuroticism. Therefore the data is given as: x…
Q: QUESTION 12 A student has the following scores on her courses for the first set of midterm exams:…
A: mean x̅ = Σx/n = 77/3 = 25.67 mean y̅ = Σy/n = 73/3 = 24.33
Q: The alternative hypothesis is: H1: CVD and Enrollment Site are dependent. H1: The correlation…
A: To test : there is a significant association between the family history of CVD and the enrollment…
Q: Example 17.12. If T1 and T2 are two unbiased estimators of y(0), having the same variance and p is…
A:
Q: A recent article reported that a job awaits only one in three new college graduates. The major…
A: From the provided information, A recent article reported that a job awaits only one in three new…
Q: Question 10 : Given the following probability table for [X1] X2 X = X2 1 3 X1 -1 0.22 0.04 0.04 1…
A: Probability is deals with the random occurrence of events is known as probability. The…
Q: If a researcher randomly assigns participants to one of two conditions, that researcher is likely to…
A: 1.A correlational design measures a relationship between the two or more variables, and if so, in…
Q: Question 3 (7 parts): 'Purchase intention' is an important metric for new products. When a new…
A: Instruction : Please answer e, f, and g. For sample 1 : Sample size , n1 = 500 Number of people…
Q: Question 5 Suppose you are thinking about investing in three stocks, X. Y and Z You consider three…
A: We have given three stocks and three different status of economy and for each status of economics…
Q: QUESTION 1 There are three different type species of Gull-Sternidae which are Laridae, Polyphyletic…
A: NOTE: As per the guidelines, we are supposed to solve the first three sub parts only. i).The…
Q: The data below represents the fields of specialization for a randomly selected sample of…
A: (a) State the hypotheses.
Q: In order to encourage car-pooling doings, a new toll charge is to be introduced on the ERIZ…
A: We have to find standard deviation..
Q: Question 1. a) Consider an experiment which measures the value of three different vari- ables on a…
A:
Q: Question 3 (5 parts): Two stocks, X and Y, have expected returns ux = 9% and uy = 7% and with…
A:
Q: Question 2) Suppose that there are two assets with ĩ = 0.15, ĩ, = 0.17, 0̟= 0.23, 02 = 0.20, and 012…
A: Given data,r1=0.15r2=0.17σ1=0.23σ2=0.20σ12=0.02w1=0.20w2-0.80
Q: Question Five The management of a supermarket wants to adopt a new promotional policy of giving free…
A: 5) The mean and standard deviation of the first customer is μX1=400σX12=900 The mean and standard…
Q: QUESTION 7 The table below gives beverage preferences for random samples of teens and adults. We are…
A: Given table, gives beverage preferences for random samples of teens and adults. Chi-Square of…
Q: QUESTION 8 There is a 30% chance that any current client of company A will switch to company B this…
A: We have to market share of tow companies.
Q: Question Five The management of a supermarket wants to adopt a new promotional policy of giving free…
A: 3. The probability of selecting a customer whose expenditure is differe than the population mean…
Q: Question 9 A completely randomized block design was conducted to compare the effects of five…
A: Note: Hi, thank you for the question. As per our company guideline we are supposed to answer only…
Q: Question 3 a) The table below represents the subject scores for 144 students. Subject Male (M)…
A: Given that Subject Male (M) Female (F) Total A: Business Ethics 4 14 18 B:…
Q: Question 2 The National Golf Association's consumer advocacy group wishes to compare the…
A: The equality of population variance can be computed using the F distribution. If the two independent…
Q: Question 1. a) Consider an experiment which measures the value of three different vari- ables on a…
A: Given Information: The maximize T-statistic is given as: T=a→Ty1¯→-a→Ty2¯→n1+n2n1n2a→TSpla→…
Q: The management of a supermarket wants to adopt a new promotional policy of giving free gift to every…
A: Given information: Distribution of X1-X2:
Q: A researcher reported the following covariance matrix for her 3-item (7-option Likert item…
A: Given: Item1 Item2 Item3 Item4 Item1 3.84 2.63 1.89 2.14 Item2 2.63 3.62…
Q: question 1) Suppose that two measurements, d1, and d2, are uncorrelated and with equal variance, od.…
A: Consider the given values in the term of difference and addition and then proceed !!
Q: Question 8 A firm uses trend projection and seasonal factors to simulate sales for a given time…
A: Given: Total number of outputs, N=10. If the sales fall, output will be "0". If the sales are…
Q: Question 1 The Valley Wine Company purchases grapes from one to two nearby growers each season to…
A: Given: The valley Wine company purchases grapes to produce 3,000 bottles of the wine
Q: The management of a supermarket wants to adopt a new promotional policy of giving free gift to every…
A: Let, X = Expenditure for a customer at this supermarket after the promotional policy is advertised.…
Q: Let Rand S denote the sample correlation matrix and the sample covariance matrix, respectively. Let…
A: Given: R is the correlation matrix S is the covariance matrix D = diag(s11,s22,......,snn)
Q: Question 4 Construct a spreadsheet simulation model to simulate 1,000 rolls of a die with the eight…
A: Given information: Two eight sided fair dice should be used for 1000 simulations.
Q: Question.9. From the following information, ascertain which project is more Project A Project B Cash…
A:
Q: Question 6. A highway traffic condition during a blizzard is hazardous. Suppose one traffic accident…
A: Given that in each 50 miles of highway on an average 1 accident occur.This means in 1 mile , 150…


Trending now
This is a popular solution!

Step by step
Solved in 2 steps with 1 images

- If a researcher randomly assigns participants to one of two conditions, that researcher is likely to use a(n): a. correlational design b. quasi-experimental design c. experimental design d. descriptive designThe following matrix shows the bivariate correlations for houses with garages. Baths Beds Sqft Age Price Baths 1 Beds 0.591 1 Sqft 0.696 0.626 1 Age -0.427 -0.133 -0.069 1 Price 0.643 0.374 0.767 -0.099 1 Baths: # of bathrooms in the house Beds: # of bedrooms in the house Sqft: # of square feet in the house Age: age of the house in years Price: selling price of house Answer the following: a) Do older houses with garages sell for lower or higher prices than newer houses with garages on average? Are older houses with garages smaller or larger than newer houses with garages on average? b) Is the correlation between baths and age weaker or stronger than correlation between beds and price? c) Is the correlation between age and sqft weaker or stronger than the correlation between age and price?The following is the correlation matrix. SALES GENDER OWNHOME MARRIED INCOME CHILDREN CATALOGS SALES 1.0000 GENDER 0.1950 1.0000 OWNHOME 0.3480 0.0844 1.0000 MARRIED 0.4711 0.1161 0.2640 1.0000 INCOME 0.6845 0.2583 0.4494 0.6652 1.0000 CHILDREN -0.2248 -0.1055 -0.0323 0.0098 0.0479 1.0000 CATALOGS 0.4664 0.0874 0.0931 0.1371 0.1779 -0.1135 1.0000 The regression equation is: estimated SALES = 247.0745 + 78.6075*CATALOGS question: What is the slope coefficient for the regression equation?
- Three funds have the following annual expected returns (E[R]), variances and covariances: Fund E[R] Variance-Covariance Matrix US Equity African Bond UK Directional US Equity 0.06 0.04 0.015 0.008 African Bond 0.08 0.015 0.09 0.018 UK Directional 0.12 0.008 0.018 0.16 (i) Calculate the correlation coefficients between each pair of funds. (ii) Calculate the expected returns and standard deviations for the following portfolios.Consider that in a retrospective cohort study involving job type and heart disease among railroad workers, the following data was obtained. heart disease job type yes no clerk 50 500 track worker 22 390 calculate the association between the two variables - The first is the covariance, and the second is the correlation coefficient.You are given the following course metrics from the 1000 students thatcompleted 'Introduction to the Matrix' for the Fall 2021 semester thatresulted in a perfectly normal distribution: Mean Course Grade - 75.0Standard Deviation of Course Grades - 5.0 You are asked to evaluate the following Course Grades from an unidentifiedclass of students:# Grade # Grade # Grade # Grade # Grade1 75 6 60 11 55 16 90 21 952 55 7 70 12 80 17 65 22 603 60 8 75 13 85 18 80 23 904 75 9 65 14 70 19 75 24 755 60 10 90 15 95 20 80 25 95(a) Is this class 25 student class representative of an 'Introduction to theMatrix' class? Provide statistical analysis (Table, Graphs, metrics, etc.) and anexplanation of the rationale used for comparison between this classof 25 students and the 1000 'Introduction to the Matrix' students.
- 1.1 The alternative hypothesis is: H1: CVD and Enrollment Site are dependent. H1: The correlation between CVD and Site is zero. H1: CVD and Enrollment Site are independent. H1: The covariance between CVD and Enrollment Site is negative. H1: The covariance between CVD and Site is zero. H1: The covariance between CVD and Enrollment Site is positive. 1.2 Under independence, calculate the expected number of patients with a family history of CVD, at Hospital 2. 1.3 A necessary condition to perform the hypothesis test is: The observed frequencies must be at least 5. The expected frequencies must be at least 5. The expected frequencies must be at least 30. The cell χ2-values must be at least z0.975=1.96. The row and column totals must be at least 3030. The cell χ2-values must be at least z0.95=1.645. The observed frequencies must be at least 30. The sample size must be at least 30. 1.4 Since the critical value is - we have sufficient evidence - the null hypothesis at α=0.01 level of…Subject Extroversion Neuroticism 1 43 49 2 46 53 3 48 67 4 48 57 5 48 56 6 50 48 7 51 60 8 51 41 9 53 51 10 58 47 11 62 41 12 63 51 13 63 30 14 63 28 15 67 55 16 67 47 17 67 39 6. What is the lower bound of the population correlation coefficient (rho) calculated from the data in personalities.xls? -the answer is NOT 0.8021 that was given when I submitted this last time.