Question 1 The below graph plots the daily prices of Gold over time. a) Examine the plot and describe the issues that may arise when trying to forecast future Gold prices given this time series data. Offer solutions to these issues. (2 marks). b) Offer a suitable forecasting method for this data. (2 marks). 600 - 500 - 400 - 300 - 200 400 600 800 1000 Time gold
Question 1 The below graph plots the daily prices of Gold over time. a) Examine the plot and describe the issues that may arise when trying to forecast future Gold prices given this time series data. Offer solutions to these issues. (2 marks). b) Offer a suitable forecasting method for this data. (2 marks). 600 - 500 - 400 - 300 - 200 400 600 800 1000 Time gold

Chapter4: Linear Functions
Section4.3: Fitting Linear Models To Data
Problem 24SE: Table 6 shows the year and the number ofpeople unemployed in a particular city for several years....

Related questions
Question
Question 1
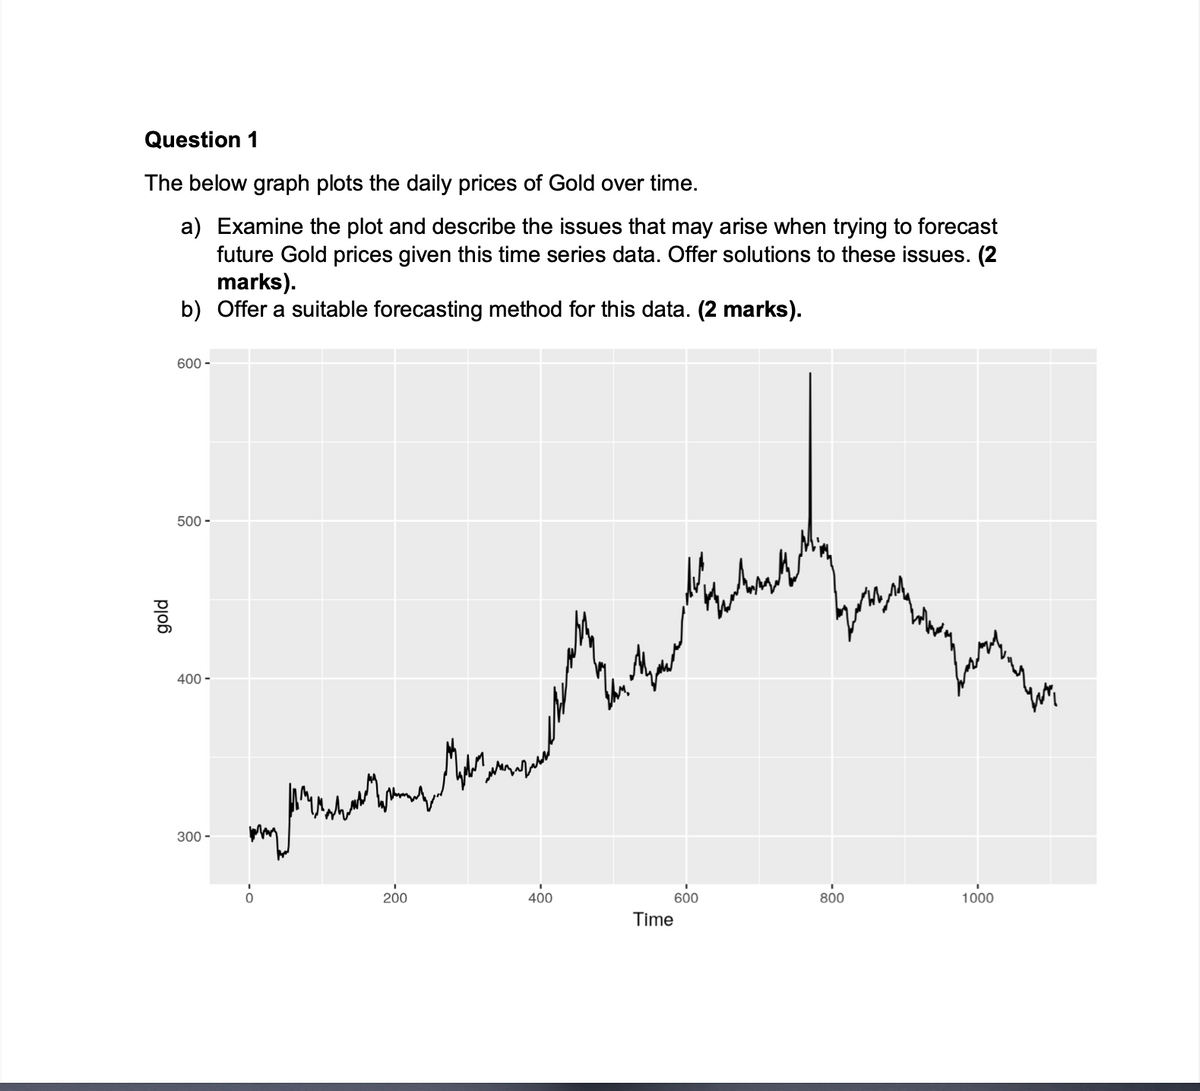
The below graph plots the daily prices of Gold over time.
-
a) Examine the plot and describe the issues that may arise when trying to forecast future Gold prices given this time series data. Offer solutions to these issues.
-
b) Offer a suitable forecasting method for this data
Transcribed Image Text:Question 1
The below graph plots the daily prices of Gold over time.
a) Examine the plot and describe the issues that may arise when trying to forecast
future Gold prices given this time series data. Offer solutions to these issues. (2
marks).
b) Offer a suitable forecasting method for this data. (2 marks).
600 -
500 -
400 -
300 -
200
400
600
800
1000
Time
gold
Expert Solution
This question has been solved!
Explore an expertly crafted, step-by-step solution for a thorough understanding of key concepts.

This is a popular solution!

Trending now
This is a popular solution!

Step by step
Solved in 2 steps

Recommended textbooks for you

Algebra & Trigonometry with Analytic Geometry
Algebra
ISBN:
9781133382119
Author:
Swokowski
Publisher:
Cengage

College Algebra
Algebra
ISBN:
9781305115545
Author:
James Stewart, Lothar Redlin, Saleem Watson
Publisher:
Cengage Learning
Algebra & Trigonometry with Analytic Geometry
Algebra
ISBN:
9781133382119
Author:
Swokowski
Publisher:
Cengage
College Algebra
Algebra
ISBN:
9781305115545
Author:
James Stewart, Lothar Redlin, Saleem Watson
Publisher:
Cengage Learning

Intermediate Algebra
Algebra
ISBN:
9781285195728
Author:
Jerome E. Kaufmann, Karen L. Schwitters
Publisher:
Cengage Learning