Question 3 We have a time series dataset from the US which includes the following variables for the period 1960- 1999: • Y₁: Per capita chicken consumption (in pounds) in year t. . PC: The price of chicken (in cents per pound) in year t.
Question 3 We have a time series dataset from the US which includes the following variables for the period 1960- 1999: • Y₁: Per capita chicken consumption (in pounds) in year t. . PC: The price of chicken (in cents per pound) in year t.

MATLAB: An Introduction with Applications
6th Edition
ISBN:9781119256830
Author:Amos Gilat
Publisher:Amos Gilat
Chapter1: Starting With Matlab
Section: Chapter Questions
Problem 1P

Related questions
Question
the question 3 is for context, need help answering just for the c section
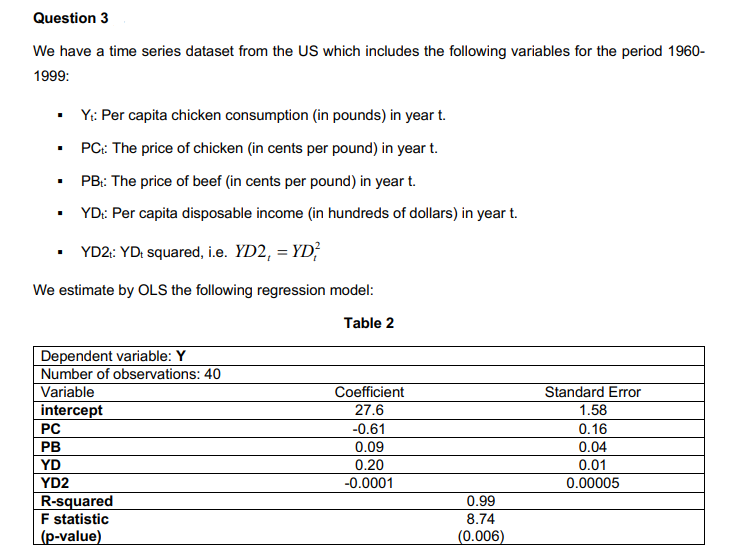
Transcribed Image Text:Question 3
We have a time series dataset from the US which includes the following variables for the period 1960-
1999:
Yt: Per capita chicken consumption (in pounds) in year t.
PC: The price of chicken (in cents per pound) in year t.
PB: The price of beef (in cents per pound) in year t.
YD: Per capita disposable income (in hundreds of dollars) in year t.
YD2t: YD+ squared, i.e. YD2, = YD²
We estimate by OLS the following regression model:
Table 2
■
.
Dependent variable: Y
Number of observations: 40
Variable
intercept
PC
PB
YD
YD2
R-squared
F statistic
(p-value)
Coefficient
27.6
-0.61
0.09
0.20
-0.0001
0.99
8.74
(0.006)
Standard Error
1.58
0.16
0.04
0.01
0.00005
Transcribed Image Text:O
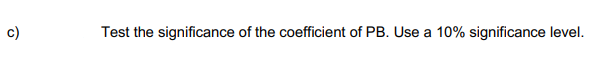
Test the significance of the coefficient of PB. Use a 10% significance level.
Expert Solution
This question has been solved!
Explore an expertly crafted, step-by-step solution for a thorough understanding of key concepts.

Step by step
Solved in 2 steps with 3 images

Recommended textbooks for you
MATLAB: An Introduction with Applications
Statistics
ISBN:
9781119256830
Author:
Amos Gilat
Publisher:
John Wiley & Sons Inc

Probability and Statistics for Engineering and th…
Statistics
ISBN:
9781305251809
Author:
Jay L. Devore
Publisher:
Cengage Learning

Statistics for The Behavioral Sciences (MindTap C…
Statistics
ISBN:
9781305504912
Author:
Frederick J Gravetter, Larry B. Wallnau
Publisher:
Cengage Learning
MATLAB: An Introduction with Applications
Statistics
ISBN:
9781119256830
Author:
Amos Gilat
Publisher:
John Wiley & Sons Inc
Probability and Statistics for Engineering and th…
Statistics
ISBN:
9781305251809
Author:
Jay L. Devore
Publisher:
Cengage Learning
Statistics for The Behavioral Sciences (MindTap C…
Statistics
ISBN:
9781305504912
Author:
Frederick J Gravetter, Larry B. Wallnau
Publisher:
Cengage Learning

Elementary Statistics: Picturing the World (7th E…
Statistics
ISBN:
9780134683416
Author:
Ron Larson, Betsy Farber
Publisher:
PEARSON

The Basic Practice of Statistics
Statistics
ISBN:
9781319042578
Author:
David S. Moore, William I. Notz, Michael A. Fligner
Publisher:
W. H. Freeman

Introduction to the Practice of Statistics
Statistics
ISBN:
9781319013387
Author:
David S. Moore, George P. McCabe, Bruce A. Craig
Publisher:
W. H. Freeman