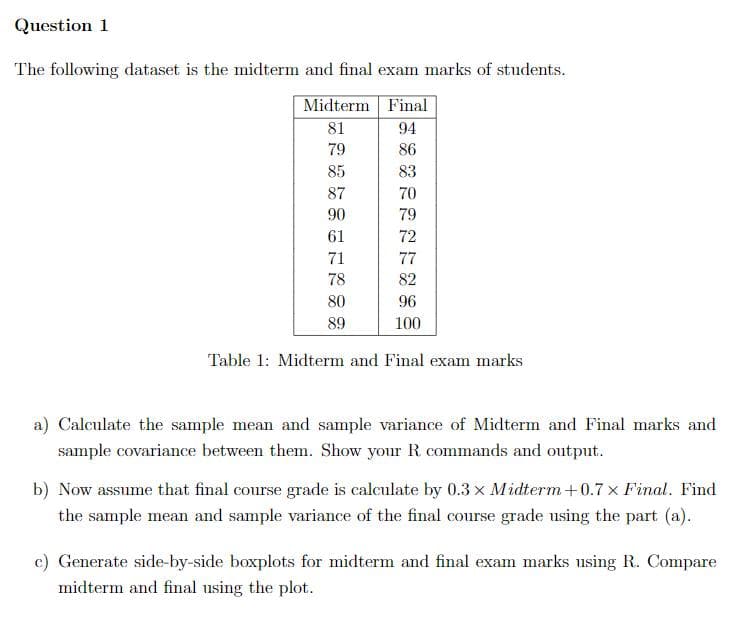
Question 1 The following dataset is the midterm and final exam marks of students. Midterm Final 81 94 79 86 85 83 87 70 90 79 61 72 71 77 78 82 80 96 89 100 Table 1: Midterm and Final exam marks a) Calculate the sample mean and sample variance of Midterm and Final marks and sample covariance between them. Show your R commands and output. b) Now assume that final course grade is calculate by 0.3 x Midterm+0.7 x Final. Find the sample mean and sample variance of the final course grade using the part (a). c) Generate side-by-side boxplots for midterm and final exam marks using R. Compare midterm and final using the plot.
Question 1 The following dataset is the midterm and final exam marks of students. Midterm Final 81 94 79 86 85 83 87 70 90 79 61 72 71 77 78 82 80 96 89 100 Table 1: Midterm and Final exam marks a) Calculate the sample mean and sample variance of Midterm and Final marks and sample covariance between them. Show your R commands and output. b) Now assume that final course grade is calculate by 0.3 x Midterm+0.7 x Final. Find the sample mean and sample variance of the final course grade using the part (a). c) Generate side-by-side boxplots for midterm and final exam marks using R. Compare midterm and final using the plot.

Functions and Change: A Modeling Approach to College Algebra (MindTap Course List)
6th Edition
ISBN:9781337111348
Author:Bruce Crauder, Benny Evans, Alan Noell
Publisher:Bruce Crauder, Benny Evans, Alan Noell
Chapter5: A Survey Of Other Common Functions
Section5.3: Modeling Data With Power Functions
Problem 6E: Urban Travel Times Population of cities and driving times are related, as shown in the accompanying...

Related questions
Question
I need the answer as soon as possible
Transcribed Image Text:Question 1
The following dataset is the midterm and final exam marks of students.
Midterm Final
81
94
79
86
85
83
87
70
90
79
61
72
71
77
78
82
80
96
89
100
Table 1: Midterm and Final exam marks
a) Calculate the sample mean and sample variance of Midterm and Final marks and
sample covariance between them. Show your R commands and output.
b) Now assume that final course grade is calculate by 0.3 x Midterm +0.7 × Final. Find
the sample mean and sample variance of the final course grade using the part (a).
c) Generate side-by-side boxplots for midterm and final exam marks using R. Compare
midterm and final using the plot.
Expert Solution
This question has been solved!
Explore an expertly crafted, step-by-step solution for a thorough understanding of key concepts.

Step by step
Solved in 4 steps with 3 images

Recommended textbooks for you
Functions and Change: A Modeling Approach to Coll…
Algebra
ISBN:
9781337111348
Author:
Bruce Crauder, Benny Evans, Alan Noell
Publisher:
Cengage Learning

Glencoe Algebra 1, Student Edition, 9780079039897…
Algebra
ISBN:
9780079039897
Author:
Carter
Publisher:
McGraw Hill
Functions and Change: A Modeling Approach to Coll…
Algebra
ISBN:
9781337111348
Author:
Bruce Crauder, Benny Evans, Alan Noell
Publisher:
Cengage Learning
Glencoe Algebra 1, Student Edition, 9780079039897…
Algebra
ISBN:
9780079039897
Author:
Carter
Publisher:
McGraw Hill