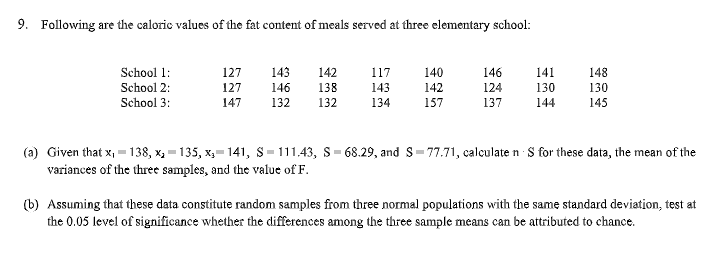
9. Following are the caloric values of the fat content of meals served at three elementary school: 143 School 1: School 2: School 3: 127 127 147 146 132 142 138 132 117 143 134 140 142 157 146 124 137 141 130 144 148 130 145 (a) Given that x, = 138, x, = 135, x,= 141, s- 111.43, S= 68.29, and S=77.71, calculate n S for these data, the mean of the variances of the three samples, and the value of F. (b) Assuming that these data constitute random samples from three normal populations with the same standard deviation, test at the 0.05 level of significance whether the differences among the three sample means can be attributed to chance.
9. Following are the caloric values of the fat content of meals served at three elementary school: 143 School 1: School 2: School 3: 127 127 147 146 132 142 138 132 117 143 134 140 142 157 146 124 137 141 130 144 148 130 145 (a) Given that x, = 138, x, = 135, x,= 141, s- 111.43, S= 68.29, and S=77.71, calculate n S for these data, the mean of the variances of the three samples, and the value of F. (b) Assuming that these data constitute random samples from three normal populations with the same standard deviation, test at the 0.05 level of significance whether the differences among the three sample means can be attributed to chance.

MATLAB: An Introduction with Applications
6th Edition
ISBN:9781119256830
Author:Amos Gilat
Publisher:Amos Gilat
Chapter1: Starting With Matlab
Section: Chapter Questions
Problem 1P

Related questions
Question
9.
Transcribed Image Text:9. Following are the caloric values of the fat content of meals served at three elementary school:
School 1:
127
143
142
117
140
146
141
148
School 2:
127
146
138
143
142
124
130
130
School 3:
147
132
132
134
157
137
144
145
(a) Given that x, = 138, x, = 135, x,= 141, s-111.43, S= 68.29, and S=77.71, calculate n S for these data, the mean of the
variances of the three samples, and the value of F.
(b) Assuming that these data constitute random samples from three normal populations with the same standard deviation, test at
the 0.05 level of significance whether the differences among the three sample means can be attributed to chance.
Expert Solution
This question has been solved!
Explore an expertly crafted, step-by-step solution for a thorough understanding of key concepts.

Step by step
Solved in 3 steps with 1 images

Recommended textbooks for you
MATLAB: An Introduction with Applications
Statistics
ISBN:
9781119256830
Author:
Amos Gilat
Publisher:
John Wiley & Sons Inc

Probability and Statistics for Engineering and th…
Statistics
ISBN:
9781305251809
Author:
Jay L. Devore
Publisher:
Cengage Learning

Statistics for The Behavioral Sciences (MindTap C…
Statistics
ISBN:
9781305504912
Author:
Frederick J Gravetter, Larry B. Wallnau
Publisher:
Cengage Learning
MATLAB: An Introduction with Applications
Statistics
ISBN:
9781119256830
Author:
Amos Gilat
Publisher:
John Wiley & Sons Inc
Probability and Statistics for Engineering and th…
Statistics
ISBN:
9781305251809
Author:
Jay L. Devore
Publisher:
Cengage Learning
Statistics for The Behavioral Sciences (MindTap C…
Statistics
ISBN:
9781305504912
Author:
Frederick J Gravetter, Larry B. Wallnau
Publisher:
Cengage Learning

Elementary Statistics: Picturing the World (7th E…
Statistics
ISBN:
9780134683416
Author:
Ron Larson, Betsy Farber
Publisher:
PEARSON

The Basic Practice of Statistics
Statistics
ISBN:
9781319042578
Author:
David S. Moore, William I. Notz, Michael A. Fligner
Publisher:
W. H. Freeman

Introduction to the Practice of Statistics
Statistics
ISBN:
9781319013387
Author:
David S. Moore, George P. McCabe, Bruce A. Craig
Publisher:
W. H. Freeman