1. The following data gives the number of social interactions of longer than 10 minutes in one week for a group of college students. (7 points) 2 7 12 17 22 27 32 37 42 47 Compute the range, variance, and standard deviation.
Q: 4. Calculate the mean deviation (from median) from the following data and also calculate its co-…
A:
Q: Consider the following raw data representing yield of Barley (in quintals) of three farmers from…
A: (A) The table of calculations is given below; No. Farmer 1 (x1) Farmer 2 (x2) Farmer 3 (x3)…
Q: 1. The following data is the acetaminophen content (in mg) in 10 separate tablets of Panadol Extra…
A: Given data, 224.3,240.4,246.3,239.4,253.1,261.7,229.4,255.5,235.5,249.7
Q: 20. The following table gives the marks obtained by a group of 80 Students in an examination.…
A: The frequency of a class in a grouped data represented the number of observation lies in a class.…
Q: Find the coefficient of correlation for the following table: 18 22 х: 10 14 26 30 у: 18 12 24 6 30…
A: Correlation coefficient measures the strength and direction of the linear relationship between two…
Q: 2. A pet association claims that the mean annual costs of food for dogs and cats are the same. The…
A: Given that A pet association claims that the mean annual costs of food for dogs and cats are the…
Q: Following is the data related to the daily production of the two factories of same product located…
A: Let, X:Factory 1 Y:Facrory 2 Therefore, X: 66,73,83,74,73,73,69,82,71,73,66,67,80,79,78 n1=15 Y:…
Q: The owner of a minor league baseball team pays the nine starting players, the manager, and two…
A: x (x-xbar)^2 70 16900 100 10000 135 4225 175 625 185 225 190 100 205 25 210 100…
Q: Jennifer 229 Samantha 425 Phillip 565 Erin 246 Stanley 348 Dominic 315 Luke 278 Charlie 198 Lexie…
A: solution:-
Q: - 6-6. Calculate mean deviation from median of the following distribution. Class Interval 50 100 100…
A:
Q: 1. The following data gives the number of social interactions of longer than 10 minutes in one week…
A: As per our guidelines we are supposed to answer only one question. Kindly repost other question as…
Q: b) The following table gives the values of mean and variance of heights and weights of the 10th…
A: Mean and variance of the heights and weights of the 10th standard of a school are given.
Q: c) Following data was collected to study the effects of training on duration of unemployment. Let X…
A:
Q: 11. The following sample data give the number of delivery miles each driver drove per day for the…
A: a) For vehicle A: x x-x (x-x)2 6 -5 25 14 3 9 19 8 64 11 0 0 10 -1 1 6 -5 25 11 0 0…
Q: 2- When engineers working in the public and private sectors are compared in terms of income…
A: Given information: Confidence level = 0.95 Significance level α=0.05 Sample size of engineers…
Q: 9. Which of the following plots indicate a sample correlation coefficient close to 0? A. First plot…
A: If there is no correlation then the value of the correlation coefficient is 0.
Q: A Fortune study found that the variance in the number of vehicles owned or leased by subscribers to…
A: Consider that σ2 is the true variance of in the number of vehicles owned or leased by subscribers to…
Q: The following table gives the number of family members of a sample of employees in a company: Number…
A: Solution : Given that, Number of family members Number of employees 3 8 4 12 5 24 6 28…
Q: The following set of data is from a sample of n=6. 6 10 2 6 7 13 a. Compute the mean, median,…
A: Heh there! Thanks for posting the question. Your question has more than three sub-parts. However, we…
Q: The following table summarises four variables collected from a sample of 20 small business in the IT…
A: Here given data for, mean, median, standard deviation, variance, interquartile range, coefficient…
Q: The following table gives the grouped frequency distribution of the crime rates in 25 different…
A: Class limit Frequency(f) mid points(x) fx 34-96 13 65 845 97-159 2 128 256 160-222 0 191 0…
Q: The asking prices (in thousands of dollars) for a sample of 13 houses currently on the market in…
A: It is given that the price of homes the following month all increase by 25%. The mean is affected by…
Q: We are interested in the number of years students in a particular elementary statistics class have…
A: Dispersion is used to measure the deviation of observation from the central measures. Variation is…
Q: The following data give the worldwide number of fatal airline accidents of commercially scheduled…
A:
Q: 9. Following are the caloric values of the fat content of meals served at three elementary school:…
A: Given: The data is shown below School 1 School 2 School 3 127 127 147 143 146 132 142 138…
Q: Suppose that 67% of college students in Australia use more than 1.65 gigabytes of data on their…
A:
Q: 2. Suppose a market analyst wants to determine the difference in the average price of a gallon of…
A: Confidence interval: The following is the confidence interval formula for difference between two…
Q: 2. The heights and arm spans of 10 adult males were measured (in cm). Is there a significant…
A: Enter the data in the cells A1:B10. The correlation coefficient using the Excel formula “=CORREL…
Q: 9. The following table gives the distribution of items of production and also the relatively…
A:
Q: (9. The following table gives the distribution of items of production and also h rufativety…
A: Given The following data for X and Y variables are provided to find the correlation coefficient…
Q: 7. In a study on the effect of exercise, ten patients had the following records: Previous Weight…
A: "Since you have posted a question with multiple sub-parts, we will solve the first three sub-parts…
Q: Table Physical Health Complaints and Burnout among Social Workers: One-Way Analysis of Variance…
A:
Q: Histogram: fines paid by drivers 12 10 4. 1 2 3 More Number of fines paid a year by a driver Compute…
A:
Q: Q2/ The number of faculty listed for a variety of private colleges that offer only bachelor's…
A: The number of faculty listed for a variety of private colleges that offer only bachelor's degrees is…
Q: Q1) The following data represent the difference in scores between the winning and losing teams in a…
A: Point Difference (interval) Frequency(f) Mid value (x) (f)(x) (fx2) 1 – 5 8…
Q: 1. According to a fast food manager, the average number of customers between 8am to 11am is 10, with…
A: Given, Outlet No. of customers 1 11 2 10 3 9 4 10 5 10 6 11 7 11 8 10 9 12 10…
Q: the following are the scores of ten ABM students in their fourth-quarter examination: 26 37 45 35…
A: Solution: Let X be the scores. The given data is 26, 37, 45, 35, 31, 47, 23, 34, 44 and 38.
Q: The owner of a chain of fruit shakes stores would like to study the correlation between atmospheric…
A:
Q: A. The following table shows the number of home runs hit by leaders in the category for the national…
A: A data can be raw or grouped, with some pro and cons associated with both of them. The raw data has…
Q: The following is the frequency distribution for the speeds of a sample of automobiles traveling on…
A: From the given information, let x be the speed of automobile travelling on an interstate highway.…
Q: The following data represent the number of packages of 5 popular brands of cigarettes sold by a…
A: Given : A B C D E 21 35 45 23 29 32 41 31 35 45 38 19 36 32 22 28 12 48 53 36…
Q: The following table gives the grouped frequency distribution of the crime rates in 25 different…
A: Given information, To find the variance and standard deviation
Q: 6. Data on GNP per capita and Birth Rate (births per thousand inhabitants) for a sample of 14…
A: Given - x¯ =1217.857143 and y¯ =39.35714286 ∑x=17050 ∑y=551 ∑x2=41185500 ∑y2=23265…
Q: The following data, based on 450 students, are given for marks in Statistics and Economics at a…
A:
Q: 1. The following data gives the number of social interactions of longer than 10 minutes in one week…
A:
Q: Compute each of the single-variable statistics discussed in class for the data below: 84.7 58.2…
A: Arrange the given data in ascending order44.3, 58.2, 58.2, 68.3, 84.1, 84.7, 89.1, 89.7, 91.9,…
Q: Which of the following conclusion would represent a lype l| Error? Concluding that the movie will…
A: Type II error: In statistics it is defined as the acceptance of null hypothesis even when it is…
Q: Compute the Mean, Median, Mode of the two groups (Male and Female) Female Height (inch) Frequency…
A: x f fx 59 1 59 60 5 300 61 1 61 62 4 248 63 3 189 66 1 66 ∑f=15 ∑fx=923…
Measures of Variability
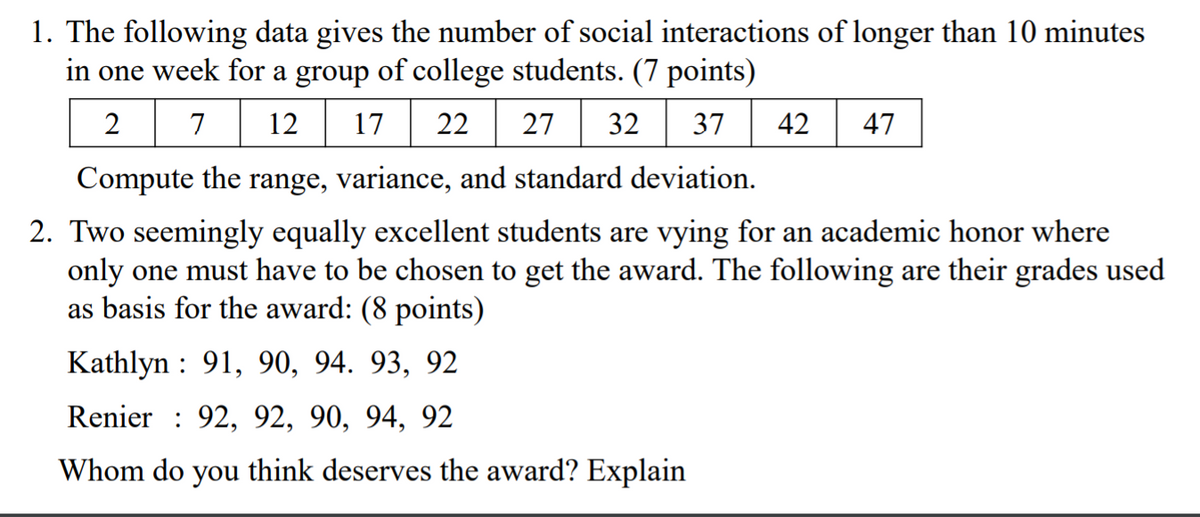
Trending now
This is a popular solution!
Step by step
Solved in 3 steps with 2 images