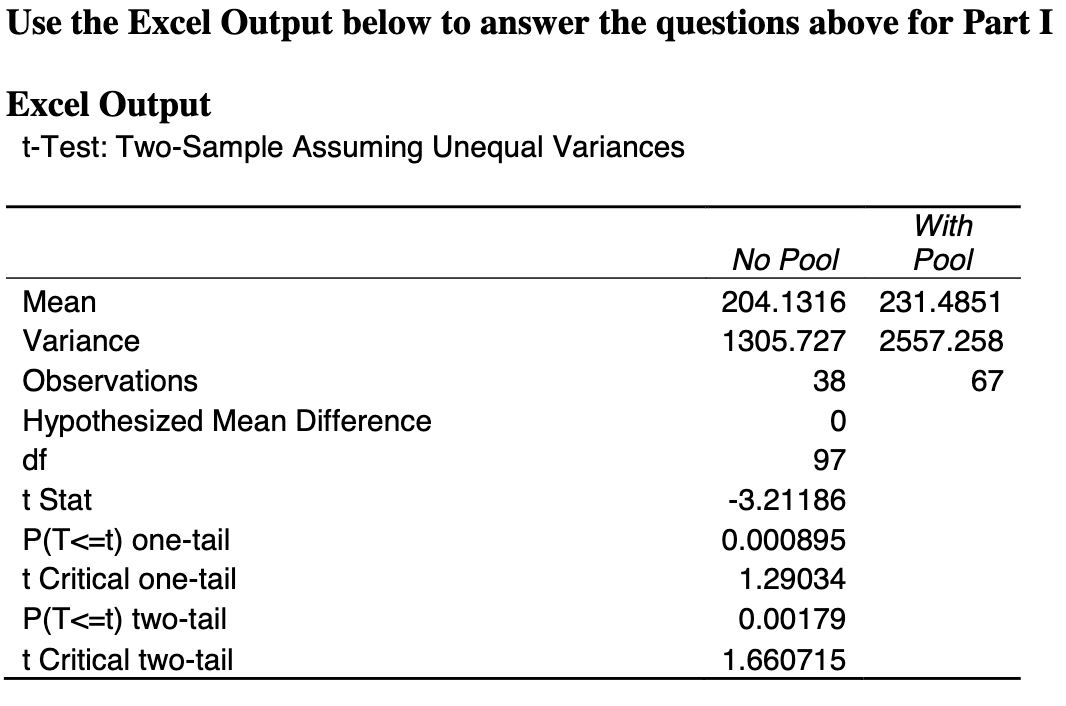
Question 1 - USE EXCEL OUTPUT a. Whatare the null and alternative hypotheses? b. At a 90% confidence level, what is the value of alpha (ª), c. What is the critical value (CV comes from the Excel outputbelow) d. What is the value of the test statistic (from the Excel outputbelow) e. What is the p-value associated with the sample statistic?(from the Excel outputbelow) f. Compare PV to alpha (include values in comparison) and TS to CV (include values from output in your comparison) g. What is your Decision? (reject/fail to reject Ho)h.What is your conclusion (in everyday terms)


Contingency Table
A contingency table can be defined as the visual representation of the relationship between two or more categorical variables that can be evaluated and registered. It is a categorical version of the scatterplot, which is used to investigate the linear relationship between two variables. A contingency table is indeed a type of frequency distribution table that displays two variables at the same time.
Binomial Distribution
Binomial is an algebraic expression of the sum or the difference of two terms. Before knowing about binomial distribution, we must know about the binomial theorem.
Question 1 - USE EXCEL OUTPUT
a. Whatare the null and alternative hypotheses?
b. At a 90% confidence level, what is the value of alpha (ª),
c. What is the critical value (CV comes from the Excel outputbelow)
d. What is the value of the test statistic (from the Excel outputbelow)
e. What is the p-value associated with the sample statistic?(from the Excel outputbelow)
f. Compare PV to alpha (include values in comparison) and TS to CV (include values from output in your comparison)
g. What is your Decision? (reject/fail to reject Ho)h.What is your conclusion (in everyday terms)


Trending now
This is a popular solution!

Step by step
Solved in 2 steps with 1 images


