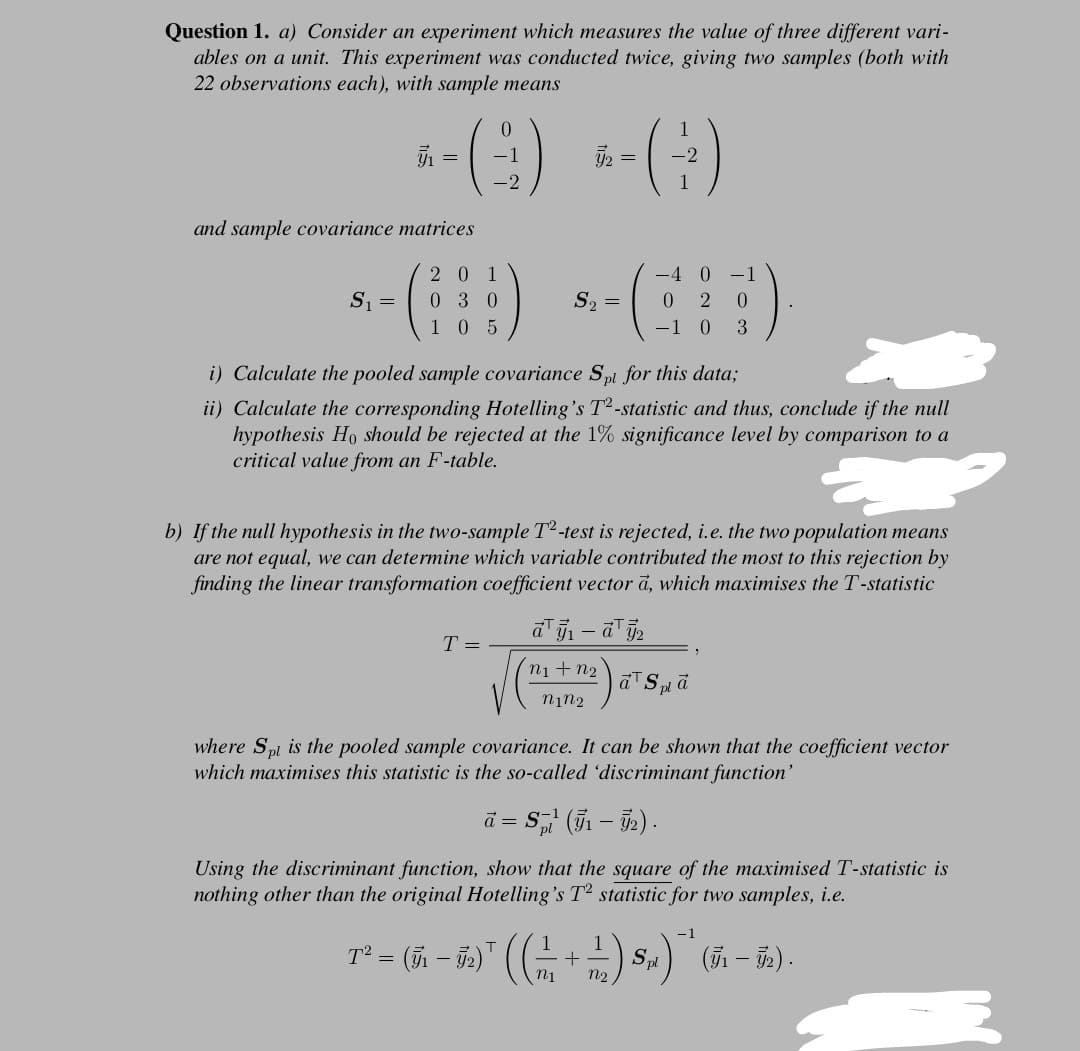
Question 1. a) Consider an experiment which measures the value of three different vari- ables on a unit. This experiment was conducted twice, giving two samples (both with 22 observations each), with sample means 0. 1 -1 あ= -2 and sample covariance matrices 201 -4 0 -1 S1 = 0 2 0 -1 0 3 030 S2 = 105 i) Calculate the pooled sample covariance Spi for this data; ii) Calculate the corresponding Hotelling's T2-statistic and thus, conclude if the null hypothesis Ho should be rejected at the 1% significance level by comparison to a critical value from an F-table. b) If the null hypothesis in the two-sample T2-test is rejected, i.e. the two population means are not equal, we can determine which variable contributed the most to this rejection by finding the linear transformation coefficient vector a, which maximises the T-statistic T = ni +n2 aTSā nin2 where Spl is the pooled sample covariance. It can be shown that the coefficient vector which maximises this statistic is the so-called 'discriminant function' ā = S, (5 – 52) . Using the discriminant function, show that the square of the maximised T-statistic is nothing other than the original Hotelling's T2 statistic for two samples, i.e. -1 T° = (m – i»)" ((, +) s.)"(5n – 5s)- 1 Sp (51 – 52) .
Question 1. a) Consider an experiment which measures the value of three different vari- ables on a unit. This experiment was conducted twice, giving two samples (both with 22 observations each), with sample means 0. 1 -1 あ= -2 and sample covariance matrices 201 -4 0 -1 S1 = 0 2 0 -1 0 3 030 S2 = 105 i) Calculate the pooled sample covariance Spi for this data; ii) Calculate the corresponding Hotelling's T2-statistic and thus, conclude if the null hypothesis Ho should be rejected at the 1% significance level by comparison to a critical value from an F-table. b) If the null hypothesis in the two-sample T2-test is rejected, i.e. the two population means are not equal, we can determine which variable contributed the most to this rejection by finding the linear transformation coefficient vector a, which maximises the T-statistic T = ni +n2 aTSā nin2 where Spl is the pooled sample covariance. It can be shown that the coefficient vector which maximises this statistic is the so-called 'discriminant function' ā = S, (5 – 52) . Using the discriminant function, show that the square of the maximised T-statistic is nothing other than the original Hotelling's T2 statistic for two samples, i.e. -1 T° = (m – i»)" ((, +) s.)"(5n – 5s)- 1 Sp (51 – 52) .

MATLAB: An Introduction with Applications
6th Edition
ISBN:9781119256830
Author:Amos Gilat
Publisher:Amos Gilat
Chapter1: Starting With Matlab
Section: Chapter Questions
Problem 1P

Related questions
Question
100%
Needed to be solve part correctly in one hour please solve correctly in one hour
Transcribed Image Text:Question 1. a) Consider an experiment which measures the value of three different vari-
ables on a unit. This experiment was conducted twice, giving two samples (both with
22 observations each), with sample means
-1
-2
-2
and sample covariance matrices
s- () --()
2 0 1
S1 =
030
0 2
-1 0 3
S2 =
105
i) Calculate the pooled sample covariance Spi for this data;
ii) Calculate the corresponding Hotelling's T2-statistic and thus, conclude if the null
hypothesis Ho should be rejected at the 1% significance level by comparison to a
critical value from an F-table.
b) If the null hypothesis in the two-sample T2 -test is rejected, i.e. the two population means
are not equal, we can determine which variable contributed the most to this rejection by
finding the linear transformation coefficient vector ā, which maximises the T-statistic
T =
ni + n2
nin2
where Spi is the pooled sample covariance. It can be shown that the coefficient vector
which maximises this statistic is the so-called 'discriminant function'
S (51 – 72) .
ā =
Using the discriminant function, show that the square of the maximised T-statistic is
nothing other than the original Hotelling's T2 statistic for two samples, i.e.
-1
T° = (n – 75)" ((- +-)
Spl
Expert Solution
This question has been solved!
Explore an expertly crafted, step-by-step solution for a thorough understanding of key concepts.

Step by step
Solved in 3 steps

Recommended textbooks for you
MATLAB: An Introduction with Applications
Statistics
ISBN:
9781119256830
Author:
Amos Gilat
Publisher:
John Wiley & Sons Inc

Probability and Statistics for Engineering and th…
Statistics
ISBN:
9781305251809
Author:
Jay L. Devore
Publisher:
Cengage Learning

Statistics for The Behavioral Sciences (MindTap C…
Statistics
ISBN:
9781305504912
Author:
Frederick J Gravetter, Larry B. Wallnau
Publisher:
Cengage Learning
MATLAB: An Introduction with Applications
Statistics
ISBN:
9781119256830
Author:
Amos Gilat
Publisher:
John Wiley & Sons Inc
Probability and Statistics for Engineering and th…
Statistics
ISBN:
9781305251809
Author:
Jay L. Devore
Publisher:
Cengage Learning
Statistics for The Behavioral Sciences (MindTap C…
Statistics
ISBN:
9781305504912
Author:
Frederick J Gravetter, Larry B. Wallnau
Publisher:
Cengage Learning

Elementary Statistics: Picturing the World (7th E…
Statistics
ISBN:
9780134683416
Author:
Ron Larson, Betsy Farber
Publisher:
PEARSON

The Basic Practice of Statistics
Statistics
ISBN:
9781319042578
Author:
David S. Moore, William I. Notz, Michael A. Fligner
Publisher:
W. H. Freeman

Introduction to the Practice of Statistics
Statistics
ISBN:
9781319013387
Author:
David S. Moore, George P. McCabe, Bruce A. Craig
Publisher:
W. H. Freeman