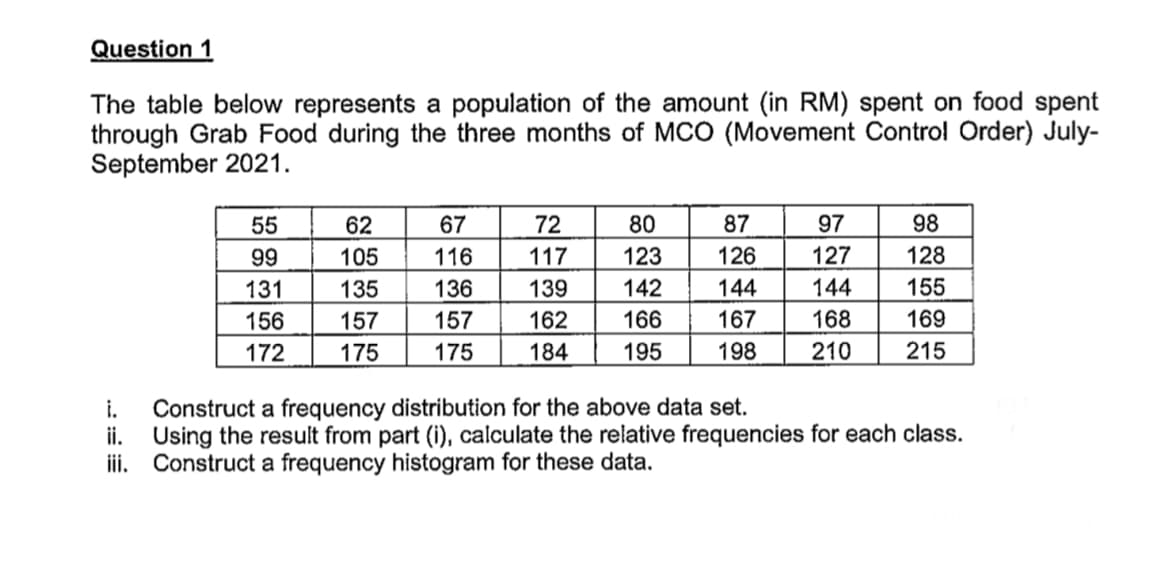
Question 1 The table below represents a population of the amount (in RM) spent on food spent through Grab Food during the three months of MCO (Movement Control Order) July- September 2021. 55 62 67 72 80 87 97 98 99 105 116 117 123 126 127 128 131 135 136 139 142 144 144 155 156 157 157 162 166 167 168 169 172 175 175 184 195 198 210 215 Construct a frequency distribution for the above data set. ii. Using the result from part (i), calculate the relative frequencies for each class. iii. Construct a frequency histogram for these data. i.
Question 1 The table below represents a population of the amount (in RM) spent on food spent through Grab Food during the three months of MCO (Movement Control Order) July- September 2021. 55 62 67 72 80 87 97 98 99 105 116 117 123 126 127 128 131 135 136 139 142 144 144 155 156 157 157 162 166 167 168 169 172 175 175 184 195 198 210 215 Construct a frequency distribution for the above data set. ii. Using the result from part (i), calculate the relative frequencies for each class. iii. Construct a frequency histogram for these data. i.

Glencoe Algebra 1, Student Edition, 9780079039897, 0079039898, 2018
18th Edition
ISBN:9780079039897
Author:Carter
Publisher:Carter
Chapter10: Statistics
Section10.6: Summarizing Categorical Data
Problem 23PPS

Related questions
Question
Transcribed Image Text:Question 1
The table below represents a population of the amount (in RM) spent on food spent
through Grab Food during the three months of MCO (Movement Control Order) July-
September 2021.
55
62
67
72
80
87
97
98
99
105
116
117
123
126
127
128
131
135
136
139
142
144
144
155
156
157
157
162
166
167
168
169
172
175
175
184
195
198
210
215
Construct a frequency distribution for the above data set.
ii. Using the result from part (i), calculate the relative frequencies for each class.
iii. Construct a frequency histogram for these data.
i.
Expert Solution
This question has been solved!
Explore an expertly crafted, step-by-step solution for a thorough understanding of key concepts.

Step by step
Solved in 4 steps with 1 images

Recommended textbooks for you
Glencoe Algebra 1, Student Edition, 9780079039897…
Algebra
ISBN:
9780079039897
Author:
Carter
Publisher:
McGraw Hill
Glencoe Algebra 1, Student Edition, 9780079039897…
Algebra
ISBN:
9780079039897
Author:
Carter
Publisher:
McGraw Hill