Question 16 Refer the to graph below to answer Questions 16-18 In the graph above, if the minimum price is set at P1, what area(s) represent the producer surplus after the implementation of this policy? Question 16 options: a) Areas B+C+E+F b) Areas B+E c) Areas E+F d) Area E e) Area B Question 17 In the graph above, if the minimum price is set at P1, what will limit the quantity of the good that is sold? Question 17 options: a) Demand b) Supply c) A government quota d) Consumer surplus e) Producer surplus Question 18 In the graph above, if the minimum price is set at P1, what area(s) represent the consumer surplus after implementing this policy? Question 18 options: a) Area A b) Areas A+B c) Areas A+C d) Areas A+B+C e) Area B


Question 16
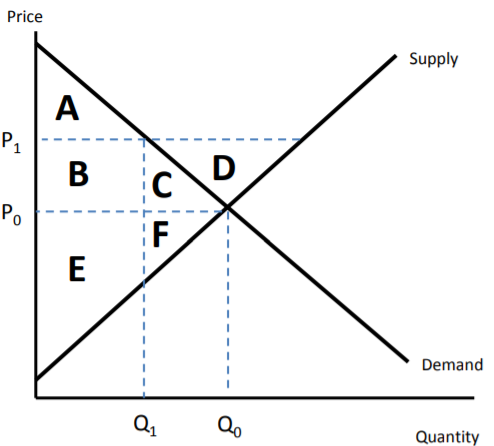
Refer the to graph below to answer Questions 16-18
In the graph above, if the minimum price is set at P1, what area(s) represent the
|
|
|
||
|
|
|
||
|
|
|
||
|
|
|
||
|
|
|
Question 17
In the graph above, if the minimum price is set at P1, what will limit the quantity of the good that is sold?
|
|
|
||
|
|
|
||
|
|
|
||
|
|
|
||
|
|
|
Question 18
In the graph above, if the minimum price is set at P1, what area(s) represent the consumer surplus after implementing this policy?
|
|
|
||
|
|
|
||
|
|
|
||
|
|
|
||
|
|
|
Question 19
The price of a blender is $35, and its value is $30, so you do not purchase it. What is the
|
|
|
||
|
|
|
||
|
|
|
||
|
|
|
Question 20
The quantity of the blender bought at the price of $35 is $300. After a sales tax of $5 is introduced, only 200 people purchase it. Is there a deadweight loss?
|
|
|
||
|
|
|
||
|
|
|
||
|
|
|


Trending now
This is a popular solution!

Step by step
Solved in 2 steps


