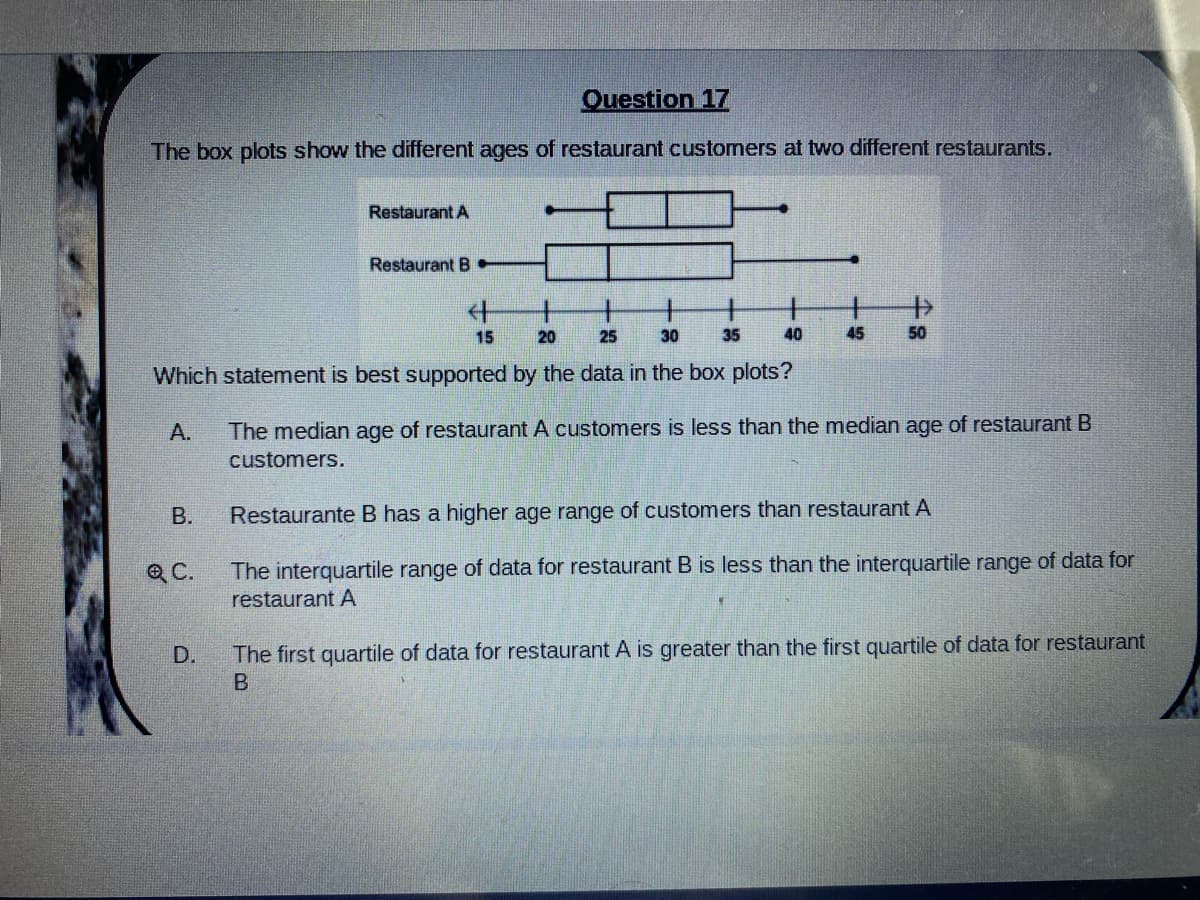
Question 17 The box plots show the different ages of restaurant customers at two different restaurants. Restaurant A Restaurant B 15 20 25 30 35 40 45 50 Which statement is best supported by the data in the box plots? А. The median age of restaurant A customers is less than the median age of restaurant B customers. В. Restaurante B has a higher age range of customers than restaurant A The interquartile range of data for restaurant B is less than the interquartile range of data for restaurant A QC. D. The first quartile of data for restaurant A is greater than the first quartile of data for restaurant


Inverse Normal Distribution
The method used for finding the corresponding z-critical value in a normal distribution using the known probability is said to be an inverse normal distribution. The inverse normal distribution is a continuous probability distribution with a family of two parameters.
Mean, Median, Mode
It is a descriptive summary of a data set. It can be defined by using some of the measures. The central tendencies do not provide information regarding individual data from the dataset. However, they give a summary of the data set. The central tendency or measure of central tendency is a central or typical value for a probability distribution.
Z-Scores
A z-score is a unit of measurement used in statistics to describe the position of a raw score in terms of its distance from the mean, measured with reference to standard deviation from the mean. Z-scores are useful in statistics because they allow comparison between two scores that belong to different normal distributions.


Trending now
This is a popular solution!

Step by step
Solved in 2 steps with 1 images


