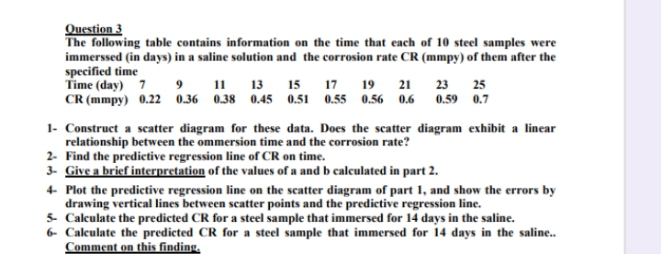
Question 3 The following table contains information on the time that each of 10 steel samples were immerssed (in days) in a saline solution and the corrosion rate CR (mmpy) of them after the specified time Time (day) 7 9 11 13 15 17 19 21 23 25 CR (mmpy) 0.22 0.36 0.38 0.45 0.51 0.55 0.56 0.6 0.59 0.7 1- Construct a scatter diagram for these data. Does the scatter diagram exhibit a linear relationship between the ommersion time and the corrosion rate? 2- Find the predictive regression line of CR on time. 3- Give a brief interpretation of the values of a and b calculated in part 2. 4 Plot the predictive regression line on the scatter diagram of part 1, and show the errors by drawing vertical lines between scatter points and the predictive regression line. 5- Calculate the predicted CR for a steel sample that immersed for 14 days in the saline. 6- Calculate the predicted CR for a steel sample that immersed for 14 days in the saline. Comment on this finding.
Question 3 The following table contains information on the time that each of 10 steel samples were immerssed (in days) in a saline solution and the corrosion rate CR (mmpy) of them after the specified time Time (day) 7 9 11 13 15 17 19 21 23 25 CR (mmpy) 0.22 0.36 0.38 0.45 0.51 0.55 0.56 0.6 0.59 0.7 1- Construct a scatter diagram for these data. Does the scatter diagram exhibit a linear relationship between the ommersion time and the corrosion rate? 2- Find the predictive regression line of CR on time. 3- Give a brief interpretation of the values of a and b calculated in part 2. 4 Plot the predictive regression line on the scatter diagram of part 1, and show the errors by drawing vertical lines between scatter points and the predictive regression line. 5- Calculate the predicted CR for a steel sample that immersed for 14 days in the saline. 6- Calculate the predicted CR for a steel sample that immersed for 14 days in the saline. Comment on this finding.

Algebra & Trigonometry with Analytic Geometry
13th Edition
ISBN:9781133382119
Author:Swokowski
Publisher:Swokowski
Chapter5: Inverse, Exponential, And Logarithmic Functions
Section5.6: Exponential And Logarithmic Equations
Problem 70E

Related questions

Question
Transcribed Image Text:Question 3
The following table contains information on the time that each of 10 steel samples were
immerssed (in days) in a saline solution and the corrosion rate CR (mmpy) of them after the
specified time
Time (day) 7
CR (mmpy) 0.22 0.36 0.38 0.45 0.51 0.55 0.56 0.6
9 11 13 15 17
23 25
0.59 0.7
19 21
1- Construct a scatter diagram for these data. Does the scatter diagram exhibit a linear
relationship between the ommersion time and the corrosion rate?
2- Find the predictive regression line of CR on time.
3- Give a brief interpretation of the values of a and b calculated in part 2.
4 Plot the predictive regression line on the scatter diagram of part 1, and show the errors by
drawing vertical lines between scatter points and the predictive regression line.
5- Calculate the predicted CR for a steel sample that immersed for 14 days in the saline.
6- Calculate the predicted CR for a steel sample that immersed for 14 days in the saline..
Comment on this finding.
Expert Solution
This question has been solved!
Explore an expertly crafted, step-by-step solution for a thorough understanding of key concepts.

Step by step
Solved in 4 steps with 2 images

Knowledge Booster


Learn more about
Need a deep-dive on the concept behind this application? Look no further. Learn more about this topic, statistics and related others by exploring similar questions and additional content below.Recommended textbooks for you
Algebra & Trigonometry with Analytic Geometry
Algebra
ISBN:
9781133382119
Author:
Swokowski
Publisher:
Cengage

Glencoe Algebra 1, Student Edition, 9780079039897…
Algebra
ISBN:
9780079039897
Author:
Carter
Publisher:
McGraw Hill

Trigonometry (MindTap Course List)
Trigonometry
ISBN:
9781337278461
Author:
Ron Larson
Publisher:
Cengage Learning
Algebra & Trigonometry with Analytic Geometry
Algebra
ISBN:
9781133382119
Author:
Swokowski
Publisher:
Cengage
Glencoe Algebra 1, Student Edition, 9780079039897…
Algebra
ISBN:
9780079039897
Author:
Carter
Publisher:
McGraw Hill
Trigonometry (MindTap Course List)
Trigonometry
ISBN:
9781337278461
Author:
Ron Larson
Publisher:
Cengage Learning