Question 2 Market researchers have studied the market for orange juice, and their estimates for the supply and the demand for orange juice per month are as follows: Price per gallon ($) Quantity demanded 200 Quantity Supplied 250 600 1 200 300 500 150 400 400 300 200 100 500 50 600 a. Using the above data, graph the demand for and the supply of orange juice. Identify the equilibrium point as E, and use dotted lines to connect E to the equilibrium price on the price axis and equilibrium quantity on the quantity axis. b. Assume that the government decided to set a price ceiling of $100 per gallon. i) Define price ceiling 11) Explain three effects unat unis legal maximum price will have on the supply of orange juice in the market. (Draw a new hypothetical diagram to illustrate)
Question 2 Market researchers have studied the market for orange juice, and their estimates for the supply and the demand for orange juice per month are as follows: Price per gallon ($) Quantity demanded 200 Quantity Supplied 250 600 1 200 300 500 150 400 400 300 200 100 500 50 600 a. Using the above data, graph the demand for and the supply of orange juice. Identify the equilibrium point as E, and use dotted lines to connect E to the equilibrium price on the price axis and equilibrium quantity on the quantity axis. b. Assume that the government decided to set a price ceiling of $100 per gallon. i) Define price ceiling 11) Explain three effects unat unis legal maximum price will have on the supply of orange juice in the market. (Draw a new hypothetical diagram to illustrate)

Chapter4: Markets In Action
Section: Chapter Questions
Problem 1SQP

Related questions
Question
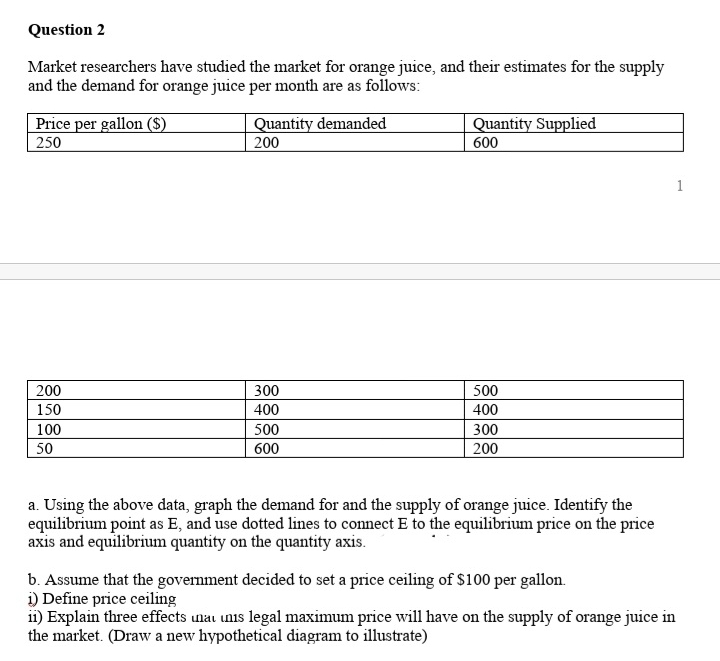
Transcribed Image Text:Question 2
Market researchers have studied the market for orange juice, and their estimates for the supply
and the demand for orange juice per month are as follows:
Price per gallon ($)
Quantity demanded
200
Quantity Supplied
250
600
1
200
300
500
150
400
400
300
200
100
500
50
600
a. Using the above data, graph the demand for and the supply of orange juice. Identify the
equilibrium point as E, and use dotted lines to connect E to the equilibrium price on the price
axis and equilibrium quantity on the quantity axis.
b. Assume that the government decided to set a price ceiling of $100 per gallon.
i) Define price ceiling
ii) Explain three effects unat unis legal maximum price will have on the supply of orange juice in
the market. (Draw a new hypothetical diagram to illustrate)
Expert Solution
This question has been solved!
Explore an expertly crafted, step-by-step solution for a thorough understanding of key concepts.

This is a popular solution!

Trending now
This is a popular solution!

Step by step
Solved in 2 steps with 2 images

Knowledge Booster


Learn more about
Need a deep-dive on the concept behind this application? Look no further. Learn more about this topic, economics and related others by exploring similar questions and additional content below.Recommended textbooks for you


Exploring Economics
Economics
ISBN:
9781544336329
Author:
Robert L. Sexton
Publisher:
SAGE Publications, Inc

Microeconomics: Principles & Policy
Economics
ISBN:
9781337794992
Author:
William J. Baumol, Alan S. Blinder, John L. Solow
Publisher:
Cengage Learning