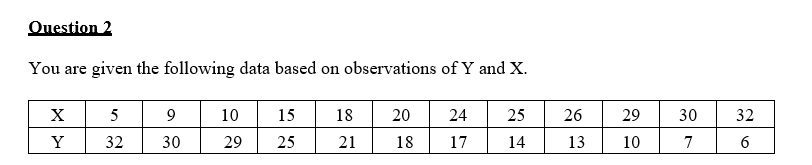
Question 2 You are given the following data based on observations of Y and X. X 5 9 10 15 18 20 24 25 26 29 30 32 Y 32 30 29 25 21 18 17 14 13 10 7 6


Q: 7. Given the following estimated regression line Y = 10.0 + 6.0 x X. R2 0.40, SER = 2.0, n = 500…
A: Answer: (1) α = 1 - (confidence level / 100) = 1 - (99/100) = 0.01 The critical probability = p* = 1…
Q: 11. The following are all least squares assumptions with the exception of: O a. They are…
A: A linear regression model produces the best estimates if it meets all the assumption of least square…
Q: Introductory Econometris: A Modern Approach 4th edition, Chapter 17 Problem 1CE: What is the command…
A: The current method is fact-based, emphasizing factual analysis of political phenomena in order to…
Q: look at the t-statistics for the relevant coefficients. analyze the standard error of estimated…
A: Polynomial regression is a type of Linear regression where simply because of the Non-straight…
Q: You are given the estimated regression equation y=234-6.2X2+082X3 R-Square-0.42 (7.2) (0.95) (0.45)…
A: The formula to calculate the test statistic is given by, t=B2Standard Error of B2=-6.20.95=-6.526…
Q: True/False 1. Omitting a variable that effects Y always biases or estimate for ß. 2. If the model is…
A: Note: Since we only answer up to 3 sub-parts, we’ll answer the first 3. Please resubmit the…
Q: The Results below show the output of the following model: ?=?0+?1?1+?2?2+? Coefficient St. Error…
A: Answer- Given in the question- The Results below show the output of the following model:…
Q: At the end of the semester the lecturer runs a regression using the student's final grade as the…
A: Estimated regression equation: Mean mark = 66 - 2 x MALE
Q: The data below gives the petrol consumption figures of cars, with the same engine size when driven…
A: We know that the equation of a straight line is: y = mx + b where m is the slope and b is the…
Q: Suppose you have a random sample of 500 individuals working in Canada, including data on hourly…
A: The multiple regression analysis is generally used to see how changes in a particular explanatory…
Q: X2 X3 X4 12 2. 13 3. 7. 2. 6. 7. 23.2 13 13 15 2. 12 15 11 17 2. In Table 1. you have data for…
A: Gauss Markov Theorem states a set of assumptions, which ensures the linear regression model…
Q: senior accounting major at Midsouth State University has job offers from four CPA firms. To explore…
A: (a) Critical value of F can be calculated:- Degree of freedom 1 is Degree of freedom of factor(can…
Q: 8. Which of the following best describes the linear probability model? The model is the application…
A: When talking about regression model, there are numerous forms of a regression to estimate the…
Q: n unbiased, observable estimator of the variance of the error term (σ2?2) is σˆ2?^2
A: Given - wage=β0+β1 educ is the econometric model. 120 =N = Number of observations
Q: Which one of the following is the most appropriate as a definition of R^2 (R- squared) in the…
A: R-squared (R2) is a measure of the proportion of the variance for a dependent variable that's…
Q: Determine the mode choice (personal vehicle or bus system) for the following regression model:…
A: The utility is the measurement of the level of satisfaction one receives from consuming a good or…
Q: 6. The following two regression models are Probit and Logit respectively: P(Y-112)-(B+B₁ × X₁ +₂×…
A: Given function Pr(Y=1|X)=ϕ(β0+β1X1+β2X2)---Probit modelPr(Y=1|X)=F(β0+β1X1+β2X2)---Logit model
Q: What is sampling? Explain the differences between probability and nonprobability samples and…
A: Answer is given below
Q: Consider a smoothing spline with smoothing (fine-tuning) parameter λ. As λ decreases, then in…
A: Sоlutiоn The соrreсt орtiоn is сhоiсe C. them in generаl, the biаs wоuld tend tо…
Q: For the regression Y = B0+B1X+u, the variance u is conditional homoskedastic. Is it correct if you…
A: Solution: The concept of regression models, the errors of a regression model, the assumptions of…
Q: (a) Q (b) (c) Tell what each of the residual plots to the right indicates about the appropriateness…
A: The vertical distance between the individual data point and the regression line is known as the…
Q: Consider the following estimated model Ipassen 8.26-0.6131fare +0.142 ldist, (0.078) (0.040)…
A: We have regression model where dependent variable is regressed on independent variables.
Q: The following information regarding a dependent variable y and an independent variable x is…
A: The numerical articulation of the connection between a reliant (result or reaction) variable and at…
Q: In Example 12.8, we found evidence of heteroskedasticity in u, in equation (12.47). Thus, we compute…
A: Return = 0.180 + 0.59 return t- 1 t statistic with standard error 0.038
Q: 36 Out of 100 persons interviewed are familiar with the tax incentive given by the governmenti for…
A: Hi! Thank you for the question, As per the honor code, we are allowed to answer one question at a…
Q: A study compared grade point averages (GPA) for students in a class: students were divided by 6…
A: Given: Sum of squared errors (SSE) = 50 Number of observations (n) = 12 Number of treatments (k) = 6
Q: You are interested in the effect of a factory being inspected on whether it reduces its pollution…
A: Introduction This effect of fussy regression can be solved by Cartesian method: number of reported…
Q: Using a standard normal distribution (mean=0, sd=1), calculate the following. (Answers in percentage…
A: A normal distribution with mean =0, and standard deviation =1 is called a standard normal…
Q: If R2 = 1, it means that all of your errors are large O your model is no better at predicting Y than…
A: The R square is a statistical measurement that looks at how variations in one variable may be…
Q: You are given the estimated regression equation y=234-6.2X2+082X3 R-Square=0.42 (7.2) (0.95) (0.45)…
A: The formula for calculation will be, t =B2Standard Error of B2=-6.20.95=-6.526
Q: You are running a probability regression. If your data contains many outliers, you’d be better off…
A: Probability regression is the statistical fitting of an s-curve logistic or logit function to a data…
Q: Describe the important characteristics of the variance of a conditional distribution of an error…
A: Linear regression is a technique that is used to predict the value of one dependent variable Y (the…
Q: regression result for your product is shown in the table below: Variable Parameter Estimates…
A: “Since you have posted a question with multiple sub-parts, we will solve the first three sub-parts…
Q: The variance of sample means is:
A: To find : Variance of sample given.
Q: What is the model constant when the dummy variable equals 1 in the following equations, where x1 is…
A: Dummy variable is the categorical variable that can take only two values; 0 and 1, which describes…
Q: A researcher estimates a regression using two different software packages.The first uses the…
A: The regression is a method of finding the mathematical relationship between the dependent and…
Q: The average expenditure on Valentine's Day was expected to be $100.89 (USA Today, February 13,…
A: A market is a place where the buyers and sellers interact with each other and the exchange of goods…
Q: Given the following data .Find the OLS estimators using the deviation method. Y 6 10 9 14 7 5 X1…
A: Y X1 X2 6 1 3 10 3 -1 9 2 4 14 -2 6 7 3 2 5 5 4 Using excel, we get the regression…
Q: Consider the estimated equation from your textbook: Test Score 698.9- 2.28 x STR, R = 0.051, SER=…
A: The t-value expresses the magnitude of the difference in terms of the variance in your sample data.…
Q: Let (X1,. Xn) be an i.i.d. sample from X, where Var(X) < 00. Suppose you wish to estimate E[X], and…
A: * SOLUTION :- (4) The OPTION is TRUE is correct answer. Based on the given information the…
Q: Y 70 12 50 9 57 9 60 14 43 9 52 11 Find the estimators for B1 and B2 correct to decimal points and…
A: i) Using the data, we run regression and get the following summary output: i) Y=b1+b2X b1-Intercept…
Q: The expected value and variance of the random variable X are as follows: E(x) = 716.04…
A: Given information: E(x) = 716.04 var(x) = 48656.08 --------------------------
Q: When Y is regressed on X, B, > 0, sx# 0, sy# 0, and the fraction of the variation in Y explained by…
A: Note:- “Since you have asked multiple question, we will solve the first question for you. If you…
Q: The standard deviation of the error terms in an estimated regression equation is known as:
A: Error term is the left over variable in a model when independent and dependent variable are unable…
Q: 5- zero correlation does not necessarily imply independence between the two variables. This…
A: Zero correlation means there is no static relationship between the two variables. It is very…
Q: DEPENDENT VARIABLE Qc R- SQUARE P- VALUE ON F 64 0.8093 0.0001 INDEPENDENT VARIABLE…
A:
Q: 2. Below is the estimated demand function for high-class tea (cups per month). Variable Estimated…
A: From the given data, following demand function can be estimated: Q(n) = 0.22 - 1.43P + 0.86Y + 3.29M…
Q: The multivariate demand function below will be needed for questions 12-18. Setting: Grapple,…
A: 12. The coefficient of the price of Holographic digital video (Pdv) is 20, which reflects that…
Q: Setting: Grapple, Inc. is a leading seller of laptop personal computers. However, they want to…
A: “Since you have posted a question with multiple sub-parts, we will solve the first three sub-parts…
Required:
i)Based on the data, construct the sample regression function (SRF).
ii)Compute the variance for β0 and β1.
iii)Compute the standard error for β0 and β1.

Step by step
Solved in 2 steps


- Ten economists were asked to predict the percentage growth in the Consumer Price Index over the next year. Their forecasts were as follows: 3.6 3.1 3.9 3.7 3.5 3.7 3.4 3.0 3.7 3.4 a. Compute the sample mean. b. Compute the sample median. c. Find the mode.if the relationship between two variables is linear and the coefficient of determination (R2) has a value near 1, the scatter diagram has what appearance?For the following time series plots, explain what type of transformation, if any, would make the variance more stable.
- Does the following dataset satisfy GARP?(PLEASE HELP WITH 1 AND 2) The National Occupant Protection Use Survey (NOPUS) was conducted to provide probability-based data on motorcycle helmet use in the United States. The survey was conducted by sending observers to randomly selected roadway sites where they collected data on motorcycle helmet use, including the number of motorcyclists wearing a Department of Transportation (DOT)-compliant helmet (National Highway Traffic Safety Administration website, January 7, 2010). Sample data consistent with the most recent NOPUS are shown below. Answer questions 8 -10. Type of Helmet Region DOT-Compliant Noncompliant Northeast 96 62 Midwest 86 43 South 92 49 West 76 16 Total 350 170 (Hint: The above table is a cross-tabulation, but the right margin is missing. You will need to calculate the total number of motorcyclists for each region as well as the total number of motorcyclists of all four regions.) 1. What is the…Now suppose that you instead observe the value of exports for all the different products (e.g., corn, soybeans, pork, dairy products, etc.) that Colombia purchases from the US from 2000 to 2019. What type of data is this? Group of answer choices Panel Random sample Time-series Cross-sectional
- Your friend - an artist - has asked you to help her determine how many paintings sized 50x150cm she should paint for sale. She's deciding between one, two, three, or four paintings. Your friend sells the paintings for 300 monetary units each. She spends 8 hours on each painting (1 hour of work = 15 monetary units). Additionally, each painting incurs an extra cost of 40 monetary units (for canvas, backing, paints, brushes, sprays). Based on past data, you estimate that with a probability of 0.2, there will be no potential buyers; with a probability of 0.2, there will be one potential buyer; with a probability of 0.2, there will be two potential buyers; with a probability of 0.3, there will be three potential buyers; with a probability of 0.1, there will be four potential buyers. Assume that if there are fewer paintings produced than potential buyers, some (randomly selected) potential buyers will remain without a painting; otherwise, all potential buyers will purchase exactly one…The variance of the OLS estimator Select one: a. increases as the number of observations increases b. increases as the variance of the unobservable increases c. decreases as the number of observations increases d. decreases as the variance of the unobservable increases e. c) and d) are true f. b) and c) are true g. a) and b) are trueWhat is the relationship between the $ price of paint and the gallon demand for this paint? A random sample of (price, quantity) data for 7 days of operation was obtained. Construct a plot and describe the relationship between quantity and price, with emphasis on any unusual observations.(10, 100) (8, 120) (5, 200) (4, 200) (10, 90) (7, 110) (6, 150)
- A random sample of residents from various income brackets was asked their opinion on tax reform for the country of Guyana. The data so gathered were analyzed by a statistician and the results he obtained using MINITAB are shown below: Expected counts are printed below observed counts Low Middle High Total For 26 (30.67) 75 (51.11) 14 (33.22) 115 Against 60 (69.33) 95 (115.56) 105 (**) 260 Neutral 34 (20) 30 (33.33) 11 (21.67) 75 Total * 200 130 450 Chi-sq = 0.71 + 11.17 + 11.12 + *** + 3.66 + 11.89 + 9.8 + 0.33 + 5.25 = 55.2 DF =??, p-value =??? Carefully define the null and alternative hypotheses of the x2 test underlying the generation of the above table. Find the missing values ‘*’, ‘**’, ‘***’, ‘??’ and ‘???’. What is the conclusion of this test? Give reasons for your answer.In a study aimed at creating reference values, abdominal circumference (measured in cm) was measured in adult men. It was found that the relationship to age could be described as abdominal circumference = 82 + 0.3 x age a) What is the analysis that produces such a formula called? b) At what age is the average abdominal circumference 100 cm?The frequency table for 1,4,5,3,2,5,7,3,4,5,8,8,8,10 data has been prepared as follows. Please indicate the mistakes made in this table.