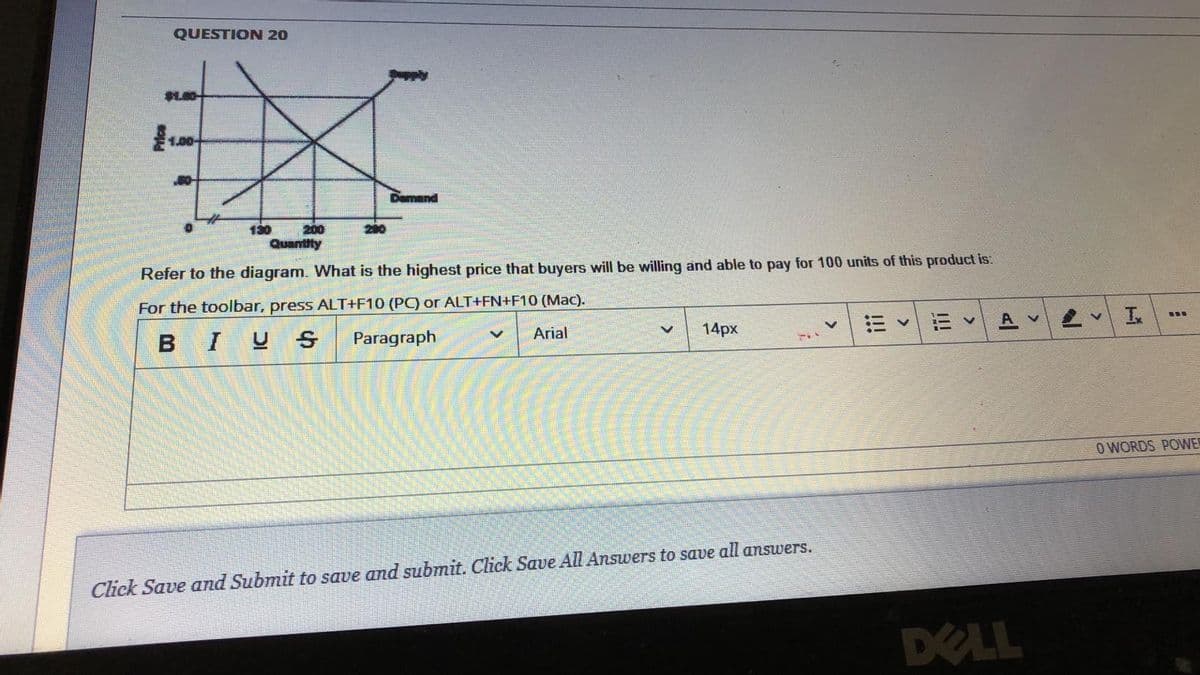
QUESTION 20 Demand 130 200 Quantity Refer to the diagram. What is the highest price that buyers will be willing and able to pay for 100 units of this product is:


Q: Mr. Ali decided to buy some sandwich and burger for his family. As he found the price of sandwich is…
A: Given Mr. Ali decided to buy some sandwich and burger for his family. As he found the price of…
Q: ellobrate the factors that will be affecting the supply of the following products in the next…
A: Crude oil: The supply of crude oil will fall in the next several years because it is a non renewable…
Q: In 2019, a ski resort increased the prices it charged for one-day ski passes and season passes. If…
A: We have given the following information Type of pass Price in 2018 Number of passes sold in 2018…
Q: Rent/Month (Php) Number of Apts. Demanded/Month Number of Apts. Supplied/Month 120.000 200 100.000…
A: An equilibrium is at such a price, where quantity demanded equals quantity supplied.
Q: contraction of the demand for clothes from 2000 units to 1500 units because price changed from 2RO…
A: The Law of demand state that when the price increases then the demand decreases for goods and…
Q: P in USD Quantity Demanded Quantlty Supplled 900 100 100 200 700 150 300 500 225 400 300 300 500 100…
A: The equilibrium is attained when the quantity supplied is equal to quantity demanded. Graphically,…
Q: Suppose both the demand for olives and the supply of olives decline by equal amounts over some time…
A: Demand: It refers to the quantity of a commodity that the consumer is willing and able to purchase…
Q: Adam is a local real estate agent. He has noticed that housing prices have increased dramatically in…
A: Demand: - Demand is the relationship between the quantity demanded and the price of a good. There is…
Q: Using the schedules given, plot the demand curve and the supply curve. Label the axes and indicate…
A: The equilibrium is the intersection of the quantity demanded and the quantity supplied. The surplus…
Q: Saima likes to buy shoes. Graphically show how Saima’s demand curve for shoes will shift in the…
A: Answer to the sub parts are as under :
Q: The price of a Boston Red Sox baseball game rises from $10 to $12 a game. The quantity of tickets…
A: Economics is a branch of social science that describes and analyzes the behaviors and decisions…
Q: Price D2 Do Pairs of Indine Roller Skates This diagram shows the market for in-line roller skates.…
A: In the production process, the conditions and fluctuations that happen between demand and also the…
Q: 21. Comrectly label the x-axis and y-axis with the terms price and quantity. 22. Assign values for…
A: A demand curve is a graphical representation of the price and quantity demanded. The demand curve…
Q: on graph paper plot demand and supply curves for chocolate bars on one graph with price of a…
A: The law of demand and the law of supply plays an important role in economics. The law of demand…
Q: Question 1 Ann-Marie bakes cheesecake for sale. She realises that the price of her flour has gone…
A: Ann- Marie bakes a cheesecake for sale. She realises that the price of the flour has gone up. As a…
Q: Question 2 TRUE/FALSE QUESTIONS Consider the following list of statements. Each statement is either…
A: 2.1 false Law of Supply states that higher the price higher the quantity supplied. 2.2 true Since…
Q: 1. 1pt. Mark appropriate circle for correct answer for matching term with its descriptions. Quantity…
A: A demand schedule is a table that displays the quantity of an item or service that is wanted at…
Q: In 1985, International Data Corporation (IDC) estimated that 3.7 million desktop computers had been…
A: The demand and supply mechanisms have several considerations regarding the determinants of the…
Q: Demand and Supply Schedules for Papaya Price $ Quantity demanded Quantity Supplied 4 36,000…
A: "Price is the payment that is made for a good or service." "Willingness to pay is the maximum price…
Q: Question1 (i) There are a total of 100 vegetable farmers. Because of the recent typhoon, 50 of the…
A: (i) The market supply and the demand curves are the summation of all the individual supply…
Q: Explain in a critical way the effects of supply and demand on seasonal agricultural products…
A: According to the principles of a market economy, supply and demand together determine the prices and…
Q: Use the following to answer questions 8-12: Figure: The Market for Hamburgers Price of hamburger…
A: Producer surplus is the area below the equilibrium market price and is above the supply curve. It is…
Q: a) The following information shows quantity demanded when prices of bread was changed from P3 to P4:…
A: Elasticity estimates the percentage change of one economic variable in light of a percentage change…
Q: horizontal axis) to calculate the price elasticity between these two prices on each of the demand…
A:
Q: The demand and supply schedules for sweet packs are displayed in the above table. а. What are the…
A: The supply for good refers to the quantity that a producer is ready to supply at each given price…
Q: Question 3: Read the following scenario and answer the questions that follow. Scenario 2: In the…
A: There are two types of related goods; substitute goods and complimentary goods. The substitute goods…
Q: The price of gasoline rises. What will happen to the demand for large pickup trucks? Draw a diagram…
A: Pickup trucks and gasoline is complementary goods. As the price of one good increases, decrease the…
Q: Explain the price elasticity of Supply along with graphical representation in detail. Explain its…
A: In most cases, this sensitivity is evaluated in terms of the amount required to change in…
Q: Ouantity Supplied 100 Price (8) Quantity benanded 50 40 30 20 10 20 40 60 140 100 60 a. Draw the…
A: Meaning of Quantity Demanded and Quantity Supplied: Demand for a commodity is always expressed…
Q: Problem The average of price of Guess bag is 45 KD, the average price of Louis Vuiton bag is…
A: Louis Vuiton bag (LVB) is a super-luxury commodity; therefore, its demand is inelastic - the change…
Q: Question - 4: Suppose the market for Computer is given by the following equations for supply and…
A: In a market, equilibrium is achieved at a point where demand curve intersects supply curve. Demand…
Q: Answer the attached question
A: Demand is the willingness of consumers for consuming goods and services at given prices. Under…
Q: Question attached
A: Income elasticity of demand depicts how much consumer responds with the change in his income.
Q: Suppose there is a product whose price is increasing but it has no impact on quantity demand…
A: If an increase in price does not change quantity demanded, it means the demand curve is vertical at…
Q: 1. Demand terminology Complete the following table by selecting the term that matches each…
A: The graph above is the demand curve. It shows the relationship between the price and the quantity…
Q: Quantity Supplied Supply Supply Schedule Law of Definition Curve Supply The amount of a good that…
A: The market is the place or a setup that involves transactions of the various goods and services…
Q: Question 5 Consider the following case. Sales of chocolate have hit a record high this year as the…
A: One of the factors contributing to the rise in cocoa prices is the rise in demand for chocolates as…
Q: Subject: Econmics II You are a manager of a retail store and you are facing a lot of challenges to…
A: Price elasticity of demand measures the degree of response of quantity demanded to change in the…
Q: Definition Quantity Supplied Supply Curve Supply Schedule Law of A graphical object showing the…
A: Answer: Answers to the table: 1. A graphical object showing the relationship between the price of a…
Q: I only need part D to be answered . Thank you! Demand and supply often shift in the retail market…
A: Note: I'll explain part d and just give you the answers to other parts so that you can verify…
Q: The price of a good rises from $16 to $24, andthe quantity supplied rises from 90 to 110…
A: The mid-point formula:Price elasticity of supply=% change in supply% change in price
Q: What happens to the equilibrium price and quantity of a good (such as alcohol) if you prohibit its…
A: If use and sale of a good is prohibited, the good is made illegal. Before when the good was legal…
Q: what does this mean in terms of the interrelationship of supply, price, and demand on two items of…
A: Demand refers to the different levels of quantity of a good that consumers are willing to purchase…
Q: Supply & Demand Analysis Activity For each scenario, show how the curve of Supply and Demand will…
A: So the impact on each scenario will be different due to different problems. Below is the table…


Trending now
This is a popular solution!

Step by step
Solved in 2 steps


- An estate agent advertises its houses in two media; Daily Graphic and Ghanaian Times. The agent believes that there is a relationship between the sales S and the amounts spent on the two advertising media. The relationship is given by; where, d is the amount spent in Daily Graphic and g is the amount spent in Ghanaian Times. The estate’s agent fee is 12½% and this includes the cost of adverting. If the agent has planned to spend only 200 thousand Ghana Cedis on advertisement, show how it should be allocated between the two media in order to maximize net profit.MNLogs harvested logs (with no inputs from other companies) from their property in northern Minnesota. They sold these logs to MNLumber for $1,000 and MNLumber cut and planed the logs into lumber. MNLumber then sold the lumber for $2,500to MNFurniture. MNFurniture used the lumber to produce 100 tables that they sold to customers for $60 each.Instructions: Enter your responses as whole numbers.a. Complete the table below to calculate the value added by each firm. Company Revenues Cost of purchased inputs Value added MNLogs $ $ $ MNLumber $ $ $ MNFurniture $ $ $ b.Suppose that all of these transactions took place in 2016. By how much did GDP increase because of these transactions?$ c.Suppose that MNLogs harvested the logs in October 2016 and sold them to MNLumber in December 2016. MNLumber then sold the finished lumber to MNFurniture in April 2017 and MNFurniture sold all 100 tables during the rest of 2017. By how much did GDP increase in 2016 and 2017 because of…Q2)Complete the following table and illustrate by graph following variables (TFC. TVC. TC. MC) TFC TVC MC ATFC ATVC ATC 20 35 38 40 55
- Table 13-7The Flying Elvis Copter Rides Quantity TotalCost FixedCost VariableCost MarginalCost AverageFixedCost AverageVariableCost AverageTotalCost 0 $50 $50 $0 -- -- -- -- 1 $150 A B C D E F 2 G H I $120 J K L 3 M N O P Q $120 R Refer to Table 13-7. Fill in ALL THE VALUES FROM A to R in the table.Table 13-7The Flying Elvis Copter Rides Quantity TotalCost FixedCost VariableCost MarginalCost AverageFixedCost AverageVariableCost AverageTotalCost 0 $50 $50 $0 -- -- -- -- 1 $150 A B C D E F 2 G H I $120 J K L 3 M N O P Q $120 R Refer to Table 13-7. What is the value of M? a. $50 b. $140 c. $360 d. $410I need both answers typing clear no chatgpt i will give 5 upvotes
- Economic Mathematics Consider the problem of inventory costs and production to satisfy a demand x for a certain product. The data is as follows: Delivery period T = 8Starting inventory x (0) = 0Ending inventory x (8) = 144Inventory cost CI (x (t)) = 7x (t)Production flow cost Cp = 3.5x'2 (t)1. Write the problem of minimizing total costs over time 2. Check the second order conditions for minimization3. Raise the Euler equation and the differential equation to solve4. Find the paths of inventory, production and total costs5. Graph the inventory and production lanes (use 0.5 increments over time)You are scheduling production of your popular Rustic Coffee Table. The table requires a top, fourlegs, 1/8 gallon of stain, 1/16 gallon of glue, 2 short braces between the legs and 2 long bracesbetween the legs, and a brass cap that goes on the bottom of each leg. You have 100 gallons ofglue in inventory, but none of the other components. All items except the brass caps, stain, andglue are ordered on a lot-for-lot basis. The caps are purchased in quantities of 1,000, stain and glueby the gallon. Lead time is 1 day for each item. a) Schedule the order releases necessary to produce 640 coffee tables on days 5 and 6, and128 on days 7 and 8. (See Appendix A1.) I need answer in appendix A1 MRP form Please take note of this !!!What is the answer of this graph? Where my graph should shift? Note:- Do not provide handwritten solution. Maintain accuracy and quality in your answer. Take care of plagiarism. Answer completely. You will get up vote for sure.