Question 3 D Two voting districts, C and M, were sampled to investigate voter opinion about tax spending. From a random sample of 100 voters in District C, 22 percent responded yes to the question "Are you in favor of an increase in state spending on the arts?" An independent random sample of 100 voters in District M resulted in 26 percent responding yes to the question. A 95 percent confidence interval for the difference (p. - Pm) was calculated as -0.04 ±0.12. Which of the following is the best interpretation of the interval? A We are 95% confident that the majority of all voters in the state favor an increase in state spending for the arts. We are 95% confident that less than half of all voters in the state favor an increase in state spending for the arts. We are 95% confident that the difference in the proportions of all voters in districts C and M who favor an increase in state spending for the arts is between -0.16 and 0.08. We are 95% confident that the difference in the sample proportions of voters in districts C and M who favor an increase in state spending for the arts is between -0.16 and D. 0.08 We are 95% confident that the proportion of all voters in the state who favor an increase in state spending for the arts is between-0.16 and 0.08
Question 3 D Two voting districts, C and M, were sampled to investigate voter opinion about tax spending. From a random sample of 100 voters in District C, 22 percent responded yes to the question "Are you in favor of an increase in state spending on the arts?" An independent random sample of 100 voters in District M resulted in 26 percent responding yes to the question. A 95 percent confidence interval for the difference (p. - Pm) was calculated as -0.04 ±0.12. Which of the following is the best interpretation of the interval? A We are 95% confident that the majority of all voters in the state favor an increase in state spending for the arts. We are 95% confident that less than half of all voters in the state favor an increase in state spending for the arts. We are 95% confident that the difference in the proportions of all voters in districts C and M who favor an increase in state spending for the arts is between -0.16 and 0.08. We are 95% confident that the difference in the sample proportions of voters in districts C and M who favor an increase in state spending for the arts is between -0.16 and D. 0.08 We are 95% confident that the proportion of all voters in the state who favor an increase in state spending for the arts is between-0.16 and 0.08

Glencoe Algebra 1, Student Edition, 9780079039897, 0079039898, 2018
18th Edition
ISBN:9780079039897
Author:Carter
Publisher:Carter
Chapter10: Statistics
Section: Chapter Questions
Problem 13PT

Related questions
Topic Video
Question
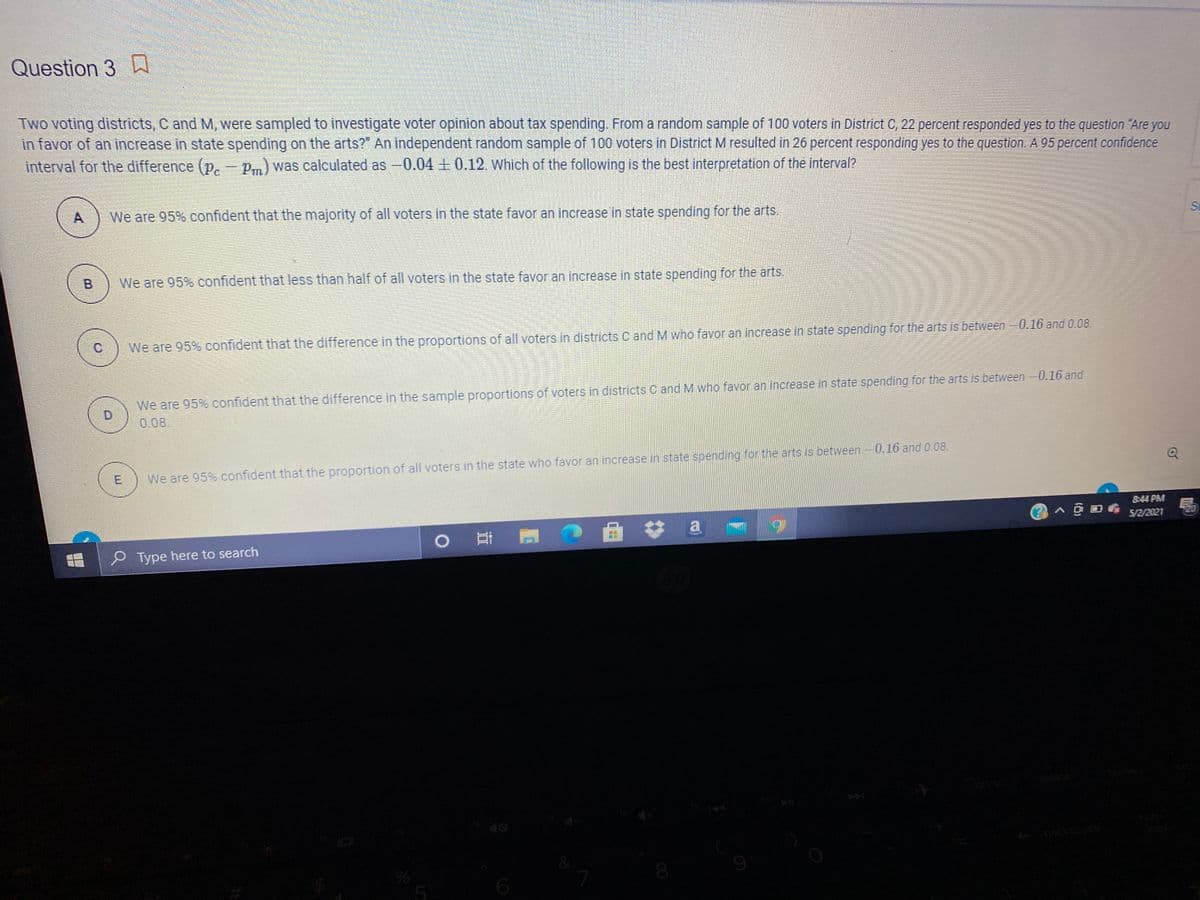
Transcribed Image Text:Question 3
Two voting districts, C and M, were sampled to investigate voter opinion about tax spending. From a random sample of 100 voters in District C, 22 percent responded yes to the question "Are you
in favor of an increase in state spending on the arts?" An independent random sample of 100 voters in District M resulted in 26 percent responding yes to the question. A 95 percent confidence
interval for the difference (p, - p.) was calculated as-0.04±0.12. hich of the following is the best interpretation of the interval?
We are 95% confident that the majority of all voters in the state favor an increase in state spending for the arts.
St
We are 95% confident that less than half of all voters in the state favor an increase in state spending for the arts.
We are 95% confident that the difference in the proportions of all voters in districts C and M who favor an increase in state spending for the arts is between 0.16 and 0.08.
We are 95% confident that the difference in the sample proportions of voters in districts C and M who favor an increase in state spending for the arts is between-0.16 and
D
0.08.
We are 95% confident that the proportion of all voters in the state who favor an increase in state spending for the arts is between -0.16 and 0.08.
E
844 PM
5/2/2021
o つ 曲#a
Type here to search
పఇఖాలు
40
backspace
5
6
%24
Expert Solution
This question has been solved!
Explore an expertly crafted, step-by-step solution for a thorough understanding of key concepts.

This is a popular solution!

Trending now
This is a popular solution!

Step by step
Solved in 2 steps

Knowledge Booster


Learn more about
Need a deep-dive on the concept behind this application? Look no further. Learn more about this topic, advanced-math and related others by exploring similar questions and additional content below.Recommended textbooks for you
Glencoe Algebra 1, Student Edition, 9780079039897…
Algebra
ISBN:
9780079039897
Author:
Carter
Publisher:
McGraw Hill

Holt Mcdougal Larson Pre-algebra: Student Edition…
Algebra
ISBN:
9780547587776
Author:
HOLT MCDOUGAL
Publisher:
HOLT MCDOUGAL

College Algebra (MindTap Course List)
Algebra
ISBN:
9781305652231
Author:
R. David Gustafson, Jeff Hughes
Publisher:
Cengage Learning
Glencoe Algebra 1, Student Edition, 9780079039897…
Algebra
ISBN:
9780079039897
Author:
Carter
Publisher:
McGraw Hill
Holt Mcdougal Larson Pre-algebra: Student Edition…
Algebra
ISBN:
9780547587776
Author:
HOLT MCDOUGAL
Publisher:
HOLT MCDOUGAL
College Algebra (MindTap Course List)
Algebra
ISBN:
9781305652231
Author:
R. David Gustafson, Jeff Hughes
Publisher:
Cengage Learning