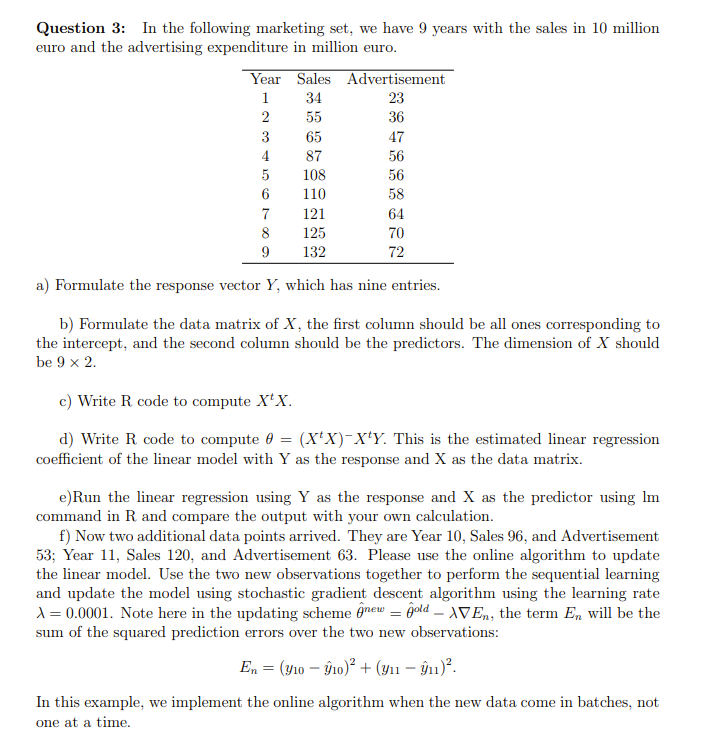
Question 3: In the following marketing set, we have 9 years with the sales in 10 million euro and the advertising expenditure in million euro. Year 1 2 3 Sales Advertisement 23 36 4 5 6 34 55 65 87 108 110 7 121 8 125 9 132 a) Formulate the response vector Y, which has nine entries. 47 56 56 58 64 70 72 b) Formulate the data matrix of X, the first column should be all ones corresponding to the intercept, and the second column should be the predictors. The dimension of X should be 9 x 2. c) Write R code to compute X¹X. d) Write R code to compute 0 = (X¹X)-X¹Y. This is the estimated linear regression coefficient of the linear model with Y as the response and X as the data matrix. e)Run the linear regression using Y as the response and X as the predictor using Im command in R and compare the output with your own calculation. f) Now two additional data points arrived. They are Year 10, Sales 96, and Advertisement 53; Year 11, Sales 120, and Advertisement 63. Please use the online algorithm to update the linear model. Use the two new observations together to perform the sequential learning and update the model using stochastic gradient descent algorithm using the learning rate A = 0.0001. Note here in the updating scheme new = ĝold - AVEn, the term En will be the sum of the squared prediction errors over the two new observations: En = (y10 − 910)² + (y₁ − ŷnı)². In this example, we implement the online algorithm when the new data come in batches, not one at a time.
Question 3: In the following marketing set, we have 9 years with the sales in 10 million euro and the advertising expenditure in million euro. Year 1 2 3 Sales Advertisement 23 36 4 5 6 34 55 65 87 108 110 7 121 8 125 9 132 a) Formulate the response vector Y, which has nine entries. 47 56 56 58 64 70 72 b) Formulate the data matrix of X, the first column should be all ones corresponding to the intercept, and the second column should be the predictors. The dimension of X should be 9 x 2. c) Write R code to compute X¹X. d) Write R code to compute 0 = (X¹X)-X¹Y. This is the estimated linear regression coefficient of the linear model with Y as the response and X as the data matrix. e)Run the linear regression using Y as the response and X as the predictor using Im command in R and compare the output with your own calculation. f) Now two additional data points arrived. They are Year 10, Sales 96, and Advertisement 53; Year 11, Sales 120, and Advertisement 63. Please use the online algorithm to update the linear model. Use the two new observations together to perform the sequential learning and update the model using stochastic gradient descent algorithm using the learning rate A = 0.0001. Note here in the updating scheme new = ĝold - AVEn, the term En will be the sum of the squared prediction errors over the two new observations: En = (y10 − 910)² + (y₁ − ŷnı)². In this example, we implement the online algorithm when the new data come in batches, not one at a time.

College Algebra
7th Edition
ISBN:9781305115545
Author:James Stewart, Lothar Redlin, Saleem Watson
Publisher:James Stewart, Lothar Redlin, Saleem Watson
Chapter6: Matrices And Determinants
Section: Chapter Questions
Problem 6P

Related questions
Question
Transcribed Image Text:Question 3: In the following marketing set, we have 9 years with the sales in 10 million
euro and the advertising expenditure in million euro.
Year
1
Sales Advertisement
34
23
36
2
3
4
5
6
7
8
9
a) Formulate the response vector Y, which has nine entries.
55
65
87
108
110
121
125
132
47
56
56
58
64
70
72
b) Formulate the data matrix of X, the first column should be all ones corresponding to
the intercept, and the second column should be the predictors. The dimension of X should
be 9 x 2.
c) Write R code to compute X¹X.
d) Write R code to compute = (XX)-X¹Y. This is the estimated linear regression
coefficient of the linear model with Y as the response and X as the data matrix.
e) Run the linear regression using Y as the response and X as the predictor using Im
command in R. and compare the output with your own calculation.
f) Now two additional data points arrived. They are Year 10, Sales 96, and Advertisement
53; Year 11, Sales 120, and Advertisement 63. Please use the online algorithm to update
the linear model. Use the two new observations together to perform the sequential learning
and update the model using stochastic gradient descent algorithm using the learning rate
X = 0.0001. Note here in the updating scheme new = gold - AVEn, the term En will be the
sum of the squared prediction errors over the two new observations:
En (310-910)² + (y₁ - 9₁1)².
In this example, we implement the online algorithm when the new data come in batches, not
one at a time.
Expert Solution
This question has been solved!
Explore an expertly crafted, step-by-step solution for a thorough understanding of key concepts.

This is a popular solution!
Step 1: Write the given information
VIEWStep 2: Formulate the response vector Y, which has nine entries and formulate the data matrix of X
VIEWStep 3: Write R code to compute X^tX and (X^tX)^(-1)X^tY
VIEWStep 4: Run the linear regression using Y as the response and X as the predictor using Im command in R
VIEWSolution
VIEW
Trending now
This is a popular solution!

Step by step
Solved in 5 steps with 16 images

Recommended textbooks for you
College Algebra
Algebra
ISBN:
9781305115545
Author:
James Stewart, Lothar Redlin, Saleem Watson
Publisher:
Cengage Learning
College Algebra
Algebra
ISBN:
9781305115545
Author:
James Stewart, Lothar Redlin, Saleem Watson
Publisher:
Cengage Learning