(c) Carry out an appropriate hypothesis test at a = 0.05 to see whether the 2016 census proportions for the 3 income groups for Edmonton (from Question 1, part (a)) are incorrect for the sample dataset. State the null and alternative hypotheses. Report the value of the appropriate test statistic, the distribution of the test statistic under the null hypothesis, and the P-value of the test to answer the question. State your conclusion.
(c) Carry out an appropriate hypothesis test at a = 0.05 to see whether the 2016 census proportions for the 3 income groups for Edmonton (from Question 1, part (a)) are incorrect for the sample dataset. State the null and alternative hypotheses. Report the value of the appropriate test statistic, the distribution of the test statistic under the null hypothesis, and the P-value of the test to answer the question. State your conclusion.

Glencoe Algebra 1, Student Edition, 9780079039897, 0079039898, 2018
18th Edition
ISBN:9780079039897
Author:Carter
Publisher:Carter
Chapter4: Equations Of Linear Functions
Section: Chapter Questions
Problem 8SGR

Related questions
Question
QUESTION (3C.PNG)
BASIS OF THE DATA (DATA.PNG)
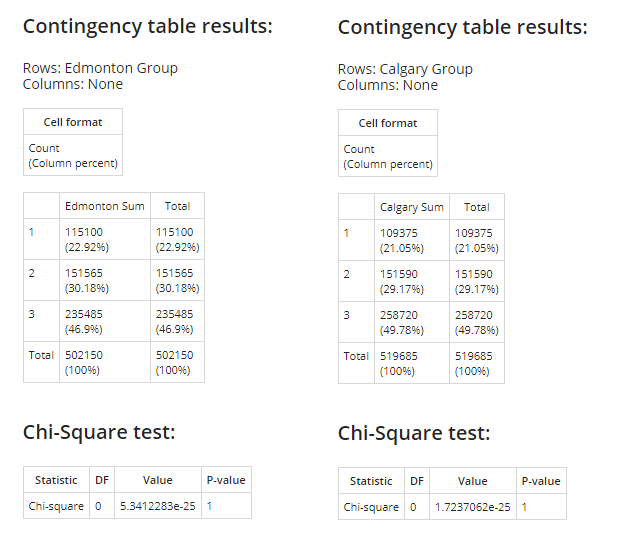
Transcribed Image Text:Contingency table results:
Contingency table results:
Rows: Edmonton Group
Columns: None
Rows: Calgary Group
Columns: None
Cell format
Cell format
Count
Count
(Column percent)
(Column percent)
Edmonton Sum
Total
Calgary Sum
Total
1
115100
115100
1
109375
109375
(22.92%)
(22.92%)
(21.05%)
(21.05%)
151565
151565
2
151590
151590
(30.18%)
(30.18%)
(29.17%)
(29.17%)
3
235485
235485
3
258720
258720
(46.9%)
(46.9%)
(49.78%)
(49.78%)
Total 502150
502150
Total 519685
519685
(100%)
(1006)
(100%)
(100%)
Chi-Square test:
Chi-Square test:
Statistic DF
Value
P-value
Statistic DF
Value
P-value
Chi-square o 5.3412283e-25 1
Chi-square o 1.7237062e-25 1
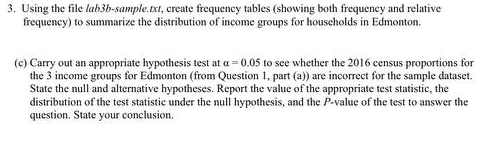
Transcribed Image Text:3. Using the file lab3b-sample.xt, create frequency tables (showing both frequeney and relative
frequeney) to summarize the distribution of income groups for houscholds in Edmonton.
(c) Carry out an appropriate hypothesis test at a = 0.05 to see whether the 2016 census proportions for
the 3 income groups for Edmonton (from Question 1, part (a)) are incorrect for the sample dataset.
State the null and alternative hypotheses. Report the value of the appropriate test statistic, the
distribution of the test statistic under the null hypothesis, and the P-value of the test to answer the
question. State your conclusion.
Expert Solution
This question has been solved!
Explore an expertly crafted, step-by-step solution for a thorough understanding of key concepts.

Step by step
Solved in 4 steps with 3 images

Recommended textbooks for you
Glencoe Algebra 1, Student Edition, 9780079039897…
Algebra
ISBN:
9780079039897
Author:
Carter
Publisher:
McGraw Hill

College Algebra (MindTap Course List)
Algebra
ISBN:
9781305652231
Author:
R. David Gustafson, Jeff Hughes
Publisher:
Cengage Learning
Glencoe Algebra 1, Student Edition, 9780079039897…
Algebra
ISBN:
9780079039897
Author:
Carter
Publisher:
McGraw Hill
College Algebra (MindTap Course List)
Algebra
ISBN:
9781305652231
Author:
R. David Gustafson, Jeff Hughes
Publisher:
Cengage Learning