

Q: If Y=10X+ square of X then the slope of Y
A: Slope of tangent y is calculated by differentiating function Y with respect to X.
Q: Indicate whether each of the following relationships is usually a direct relationship or an inverse…
A: Suppose an increase in one variable leads to an increase in another variable, then the two are…
Q: Which of the following pairs is most likely to exhibit an inverse relationship?a. The amount of time…
A: The demand curve is downward sloping, which shows the inverse or negative relationship between price…
Q: The slope for this graph is:
A: The slope of a line generally measures the rate of change of the variable in one axis to a change in…
Q: What is wrong with this graph? a. It gives no information about the units for the variables. b.…
A: Figure illustrates the relationship between the two variables. This figure supposed to shows the…
Q: In a straight line, the value of the slope differs in different points in the line. True False
A: The slope shows the steepness and direction of the line. It measures where the line is tilted, flat…
Q: The table gives information about the relationship between two variables, x and y. The…
A: The relationship between x and y can be positive, negative or remains constant depends on the values…
Q: In the accompanying graph, is the slope of curve AA′ positive or negative? Does the slope increase…
A: Slope refers to a value that makes a variation in the dependent variable by making a one-unit change…
Q: Write the equations of the vertical and horizontal lines through the point (- 1.8, - 3.6). The…
A: The equation of any vertical line is such that the value of x is fixed, while it can take any value…
Q: 100 80 60 Exam score (points) 40 20 0 2 4 6 8 Study time (hours) 10 QUESTION 1: (i) (ii) (iii)…
A: Study Time (X) Exam score (y) 2 30 4 50
Q: 100 80 60 40 20 O 40 80 120 160 200 Refer to the diagram. The equation that shows the relationship…
A: "Since you have asked multiple questions, we will solve first question for you .. If you want any…
Q: Construct a table from the data shown. Which is the dependent variable and which is the independent…
A: The above data can be shown in the following table: Exam Score Study Time 10 points 0…
Q: The slope of a curve measures the rate of change of the ___________ variable.
A: The slope of the tangent at P. The incline of a bend y = f(x) at the point P implies the slant of…
Q: On a graph, a positive linear relationship moves down from left to right. This statement is right or…
A: The relationship between two variables is called as linear when the curve representing the function…
Q: Show that the equation x + 2y- 3x +5 =0 represents a parabola. Find the focus, vertex, axis and…
A: Answer:
Q: According to the following given information how to determine: Production 1 2 3 4 5 6 7 8 9 10 11 12…
A: Introduction We have given data of a product Z. Product Z has produced 1 to 15 months as units of…
Q: Use the graph to determine the units of the slope and the ?y‑intercept.
A: The slope is the change in Y coordinate to X- coordinate. where change is the difference between two…
Q: The value of this graph as is becoming clear! Now let's consider a case in which the relationship…
A: Supply curve refers to the curve that shows the various quantities of a good or service supplied or…
Q: what is a Function? Discuss the following concepts of functions with the help of an economic example…
A: A function can be understood as the mathematical tool that helps to understand the relationship…
Q: Consider the function Y=5X0520s, where X and Z are both greater than or equal to zera. Complete the…
A: X Z Y 4 16 320 6 6 180 16 4 320 16 1 80 18 1 90 4 4 20 1 16 80 8 8 320 2 18 180…
Q: 2) Solve the following equations for X without using logarithms Za) 22x = 16 - 27 *-X - 2 2 2c) In
A: 2a) 22x=16 16 can be written in exponent form with base 2 : 24 22x=24 One of the rule of exponents…
Q: In the above figure, the line represented by the "2" is the
A: Above figure depicts perfect competition where firm produces at level of output where P = MC. 4 is…
Q: Find the slope between point And B and write with formula
A: Slope of Indifference curve = ∆Y/∆X where, ∆Y = Y2 - Y1 ∆X = X2 - X1
Q: 2. From the diagram at the right, calculate: (a). the slope for the equation in the diagram (b). the…
A: slope(m) is calculated as: m=∆y∆x=y2-y1x2-x1
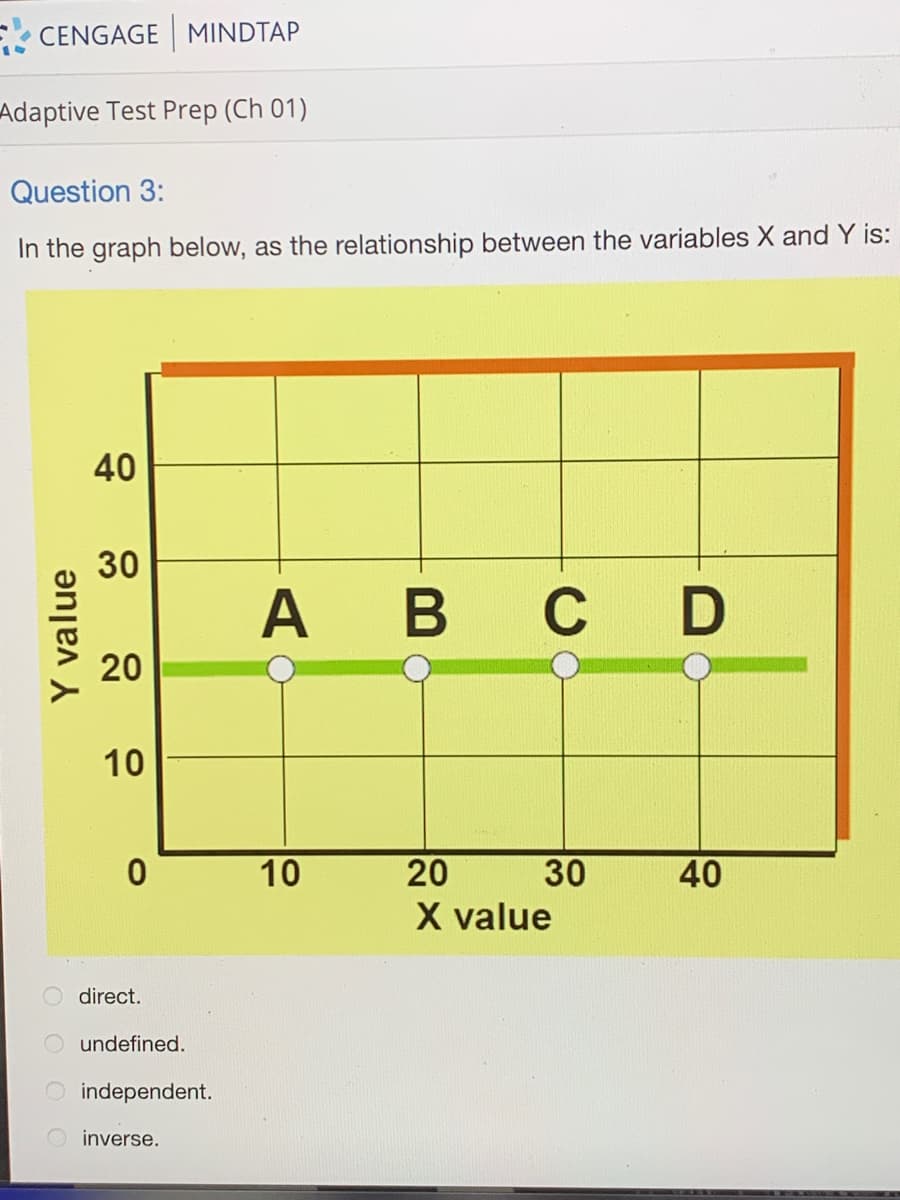
Q: A zero slope shows: positive relationship between two variables no relationship between two…
A: The slope reflects the relationship between two variables that can be graphically represented as…
Q: Construct a table from the data shown on the graph below. Which is the dependent variable and which…
A: The independent variable is the one that changes and can have a direct effect on the dependent…
Q: 1. Write this system of equations in matrix form. X1 + X2 + X3 = 1; xi – X2 = 4; x2 + X3 = 7.
A: To write this system in matrix form we will have to divide it into 3 separate Matrices, where one…
Q: Note: Use the orange line (square symbols) to plot the first equation, and use the blue line (circle…
A: Given p=6-2q ...........(1) p=4+q ...........(2)
Q: In the accompanying graph, is the slope of curve A A' positive or negative? Does the slope increase…
A: Since you have asked multiple questions, we will solve the first question for you. If you want any…
Q: Write the equations of the vertical and horizontal lines through the point (- 1.3, - 3.7). The…
A: For the Horizontal or Vertical Line, the slope of the equation (generally represented by m) is zero.…
Q: difference
A: Answer A geometric gradient series is outlined as during an income series that either will increase…
Q: Calculate the slope and vertical intercept of the line that goes through the points described in the…
A: Slope Intercept Form: A straight line's slope-intercept type is one in all the foremost frequent…
Q: Briefly describe the concept of VIF (what is it, why do we use it) and explain how to calculate VIF…
A: Multicollinearity occurs in 'ordinary least square (OLS)' regression analysis when two or more of…
Q: Erin grows pecans. The number of bushels (B) that she can produce depends on the number of inches of…
A: A function represents a rule that is able to assign a number in R1 to each number in R1 for example…
Q: Marketing surveys conducted by the sales manager for a company determined that 3,000 power drills…
A:
Q: When is a pie chart better than a bar graph for illustrating data?
A: Pie charts depict by using a circular format with slices of different sizes for various percentages…
Q: 1. What are the coordinates of the points of the following graph? Y-axis 2.5 A 2- 1.5- 1. -0.5-…
A: The following graph is drawn in x-y plane so there will be (x,y) coordinates for each point.
Q: The outside temperature can be estimated based on how fast crickets chirp. At 104 chirps per minute,…
A: Given: At 104 chirps, Temperature is 63 F. At 176 chirps, temperature is 81 F.


Trending now
This is a popular solution!

Step by step
Solved in 2 steps

- With Panel Data, if we assume that the individual effects vi are not correlated with the regressors Xit (i.e. E(vi|Xit) = 0), which one of the following statements is correct: The Fixed Effects estimator is not consistent. Both the OLS and the Random Effects estimators are not consistent. The OLS estimator is not consistent, but the Random Effects estimator is consistent. The OLS and the Random Effects estimator are consistent. All of the above. None of the aboveTRUE OR FALSE. When heterosdasticity is present OLS estimators are still BLUE.Please give a detailed answer to the question below.Options For Fill In Blank Answers:.05, .2, .25, and 5elastic or inelastic
- Previous answer was absolutely incorruplease give answer for 10, 11, and 12A traditional performance rating benchmark (or guideline) for “normal” effort, or speed, is dealing 52 cardsinto four piles, forming a square with each pile one footapart, in 0.50 minute. Conduct an experiment with one ormore fellow students in which one deals the cards andthe others rate the dealer’s performance, and then compare these subjective ratings with the actual time of thedealer.
- Consider the following formula: y i - ( β 0 ^ + β 1 ^ x i ) . What does this formula describe? OLS slope estimator Error term Causal effect of x on y residualDescribe the Probabilistic Analysis?It is sometimes said that, "Those who gamble the most are the ones who can least afford to lose." These people gamble because Group of answer choices the gambler has no family to consider if he/she dies. there is utility other than monetary to consider. the EMV is positive. the EMV is negative
- DEPENDENT VARIABLE Qc R- SQUARE P- VALUE ON F 64 0.8093 0.0001 INDEPENDENTVARIABLE PARAMETER ESTIMATE STANDARD ERROR T-RATIO P-VALUE INTERCEPT 8.20 4.01 2.04 0.0461 PC -3.54 1.64 -2.16 0.0357 M 0.64287 0.19 3.38 0.0014 PA 0.7854 0.38 2.07 0.0439 4. At the 5% level of significance, which variables are statistically significant?2. For this question use the HUI3 scoring system for the health utilities index. Assume a patient has a baseline HUI3 state of (2,2,1,4,1,3,2,4) and a 1-year follow-up HUI3 health state of (2,2,1,3,2,1,2,2) after participating in a RCT. How many QALYs does this person gain in the first year after treatment? a. Use the information from above to answer the following questions. Suppose the cost of treatment was $20,000 and the average person lived an additional 10 years. What is the cost per QALY gained for the treatment (using discounted QALYS)? Does the treatment appear cost-effective? Explain.Data 1:*2008 and 2013 National Demographic Health Survey showed that the percentage of womenage 15- 19 who had a live birth or is pregnant with first child had increased from 9.9% - 10.1% inthe country.*In Region 1, the percentage of women age fifteen 15 - 24 who havebegun childbearing also increased from 26% - 29%. This was attributed to the following riskybehaviors identified by the adolescents during the Regional Adolescent Congress: Early sex,Substance abuse, Pornography, VAWC (rape case), Fraternities (bad gangs) & Prostitution. Questions:1. What is the impact of the given data to mortality and morbidity rate of adolescent population? 2. What is the impact of the given data to mortality and morbidity rate of neonatal population? 3. Give at least 3 social determinants of health which are contributory factors leading to the datapresented and justify..