Question 3: t-test between correlated samples A teacher believes that students who study more than four hours for her tests will do better than students who do not study for her tests. To test this belief, the teacher recruited n=8 students. She had the n=8 students take one of her tests without studying. Without studying, the mean score on the test was M,=85, with a sample standard deviation of s;=5. Then the teacher had the same n=8 students take one of her tests after studying for four hours. After studying for four hours, the mean score on the test was M2=75, with a sample standard deviation of S2=4. The correlation between the 8 students' scores on the first test and the 8 students' scores on the second test was r = +.96. Perform a t-test between correlated samples by answering the questions below. Use an alpha-level of a=.05. 1. What is the research hypothesis, H,? 2. What is the null hypothesis, Ho? 3. What is the degrees of freedom for this problem, df?
Question 3: t-test between correlated samples A teacher believes that students who study more than four hours for her tests will do better than students who do not study for her tests. To test this belief, the teacher recruited n=8 students. She had the n=8 students take one of her tests without studying. Without studying, the mean score on the test was M,=85, with a sample standard deviation of s;=5. Then the teacher had the same n=8 students take one of her tests after studying for four hours. After studying for four hours, the mean score on the test was M2=75, with a sample standard deviation of S2=4. The correlation between the 8 students' scores on the first test and the 8 students' scores on the second test was r = +.96. Perform a t-test between correlated samples by answering the questions below. Use an alpha-level of a=.05. 1. What is the research hypothesis, H,? 2. What is the null hypothesis, Ho? 3. What is the degrees of freedom for this problem, df?

MATLAB: An Introduction with Applications
6th Edition
ISBN:9781119256830
Author:Amos Gilat
Publisher:Amos Gilat
Chapter1: Starting With Matlab
Section: Chapter Questions
Problem 1P

Related questions
Topic Video
Question
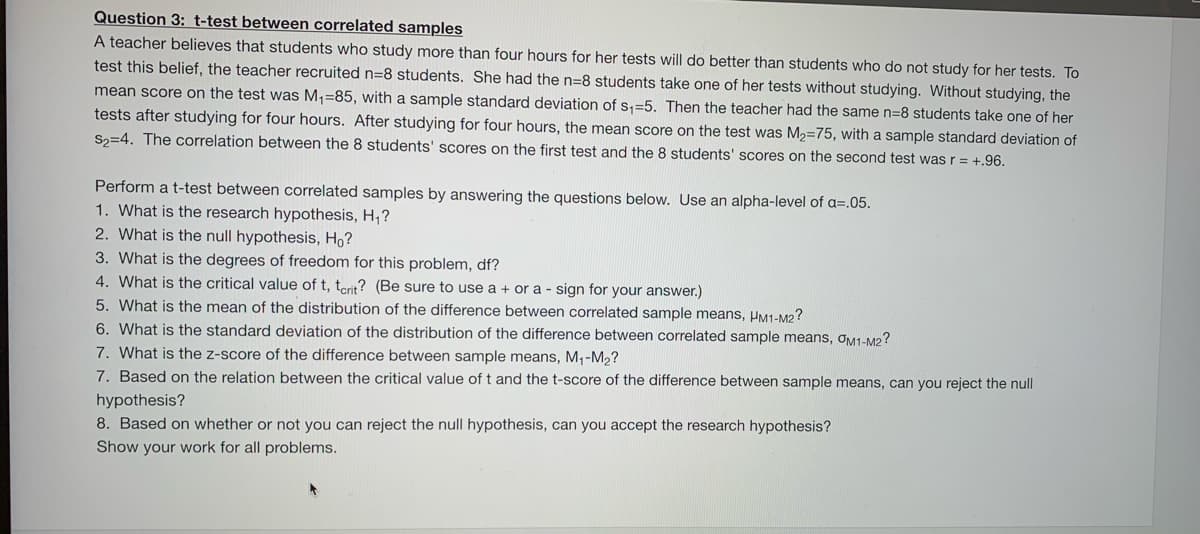
Transcribed Image Text:Question 3: t-test between correlated samples
A teacher believes that students who study more than four hours for her tests will do better than students who do not study for her tests. To
test this belief, the teacher recruited n=8 students. She had the n=8 students take one of her tests without studying. Without studying, the
mean score on the test was M1=85, with a sample standard deviation of s,=5. Then the teacher had the same n=8 students take one of her
tests after studying for four hours. After studying for four hours, the mean score on the test was M2=75, with a sample standard deviation of
S2=4. The correlation between the 8 students' scores on the first test and the 8 students' scores on the second test was r = +.96.
Perform a t-test between correlated samples by answering the questions below. Use an alpha-level of a=.05.
1. What is the research hypothesis, H,?
2. What is the null hypothesis, Ho?
3. What is the degrees of freedom for this problem, df?
4. What is the critical value of t, terit? (Be sure to use a + or a - sign for your answer.)
5. What is the mean of the distribution of the difference between correlated sample means, HM1-M2?
6. What is the standard deviation of the distribution of the difference between correlated sample means, OM1-M2?
7. What is the z-score of the difference between sample means, M,-M2?
7. Based on the relation between the critical value of t and the t-score of the difference between sample means, can you reject the null
hypothesis?
8. Based on whether or not you can reject the null hypothesis, can you accept the research hypothesis?
Show your work for all problems.
Expert Solution
This question has been solved!
Explore an expertly crafted, step-by-step solution for a thorough understanding of key concepts.

Step by step
Solved in 2 steps with 2 images

Knowledge Booster


Learn more about
Need a deep-dive on the concept behind this application? Look no further. Learn more about this topic, statistics and related others by exploring similar questions and additional content below.Recommended textbooks for you
MATLAB: An Introduction with Applications
Statistics
ISBN:
9781119256830
Author:
Amos Gilat
Publisher:
John Wiley & Sons Inc

Probability and Statistics for Engineering and th…
Statistics
ISBN:
9781305251809
Author:
Jay L. Devore
Publisher:
Cengage Learning

Statistics for The Behavioral Sciences (MindTap C…
Statistics
ISBN:
9781305504912
Author:
Frederick J Gravetter, Larry B. Wallnau
Publisher:
Cengage Learning
MATLAB: An Introduction with Applications
Statistics
ISBN:
9781119256830
Author:
Amos Gilat
Publisher:
John Wiley & Sons Inc
Probability and Statistics for Engineering and th…
Statistics
ISBN:
9781305251809
Author:
Jay L. Devore
Publisher:
Cengage Learning
Statistics for The Behavioral Sciences (MindTap C…
Statistics
ISBN:
9781305504912
Author:
Frederick J Gravetter, Larry B. Wallnau
Publisher:
Cengage Learning

Elementary Statistics: Picturing the World (7th E…
Statistics
ISBN:
9780134683416
Author:
Ron Larson, Betsy Farber
Publisher:
PEARSON

The Basic Practice of Statistics
Statistics
ISBN:
9781319042578
Author:
David S. Moore, William I. Notz, Michael A. Fligner
Publisher:
W. H. Freeman

Introduction to the Practice of Statistics
Statistics
ISBN:
9781319013387
Author:
David S. Moore, George P. McCabe, Bruce A. Craig
Publisher:
W. H. Freeman