question 3, the data in this table are from a paired-difference experime rs of observations. Pairs 93 77 104 3 74 1D 78 99 BI 69
question 3, the data in this table are from a paired-difference experime rs of observations. Pairs 93 77 104 3 74 1D 78 99 BI 69

College Algebra (MindTap Course List)
12th Edition
ISBN:9781305652231
Author:R. David Gustafson, Jeff Hughes
Publisher:R. David Gustafson, Jeff Hughes
Chapter8: Sequences, Series, And Probability
Section8.7: Probability
Problem 58E: What is meant by the sample space of an experiment?

Related questions
Question
100%
Q3 for reference is also attached
Need solution for Question#04 with two sub parts
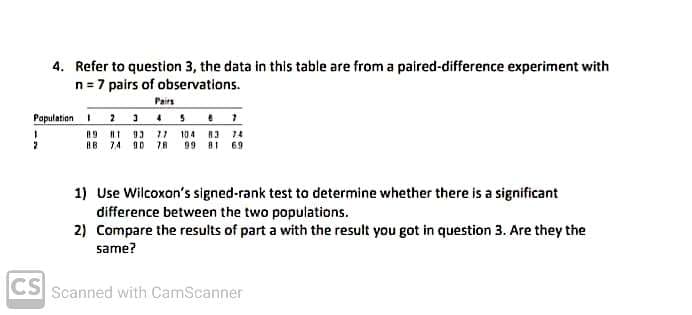
Transcribed Image Text:4. Refer to question 3, the data in this table are from a paired-difference experiment with
n = 7 pairs of observations.
Pairs
Papulation 2 15
A9 II 93 71 104 13 14
RB 74 10 78 09 81 69
1) Use Wilcoxon's signed-rank test to determine whether there is a significant
difference between the two populations.
2) Compare the results of part a with the result you got in question 3. Are they the
same?
CS
Scanned with CamScanner
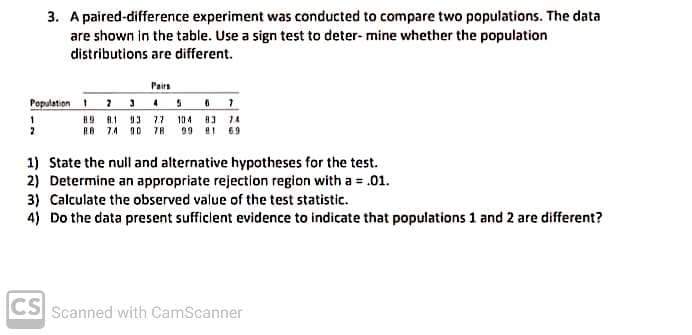
Transcribed Image Text:3. A paired-difference experiment was conducted to compare two populations. The data
are shown in the table. Use a sign test to deter- mine whether the population
distributions are different.
Pairs
Population 1 2 3 15 0 7
#9 A.1 93 7 104 H3 14
EB 74 10 78
09 1 69
1) State the null and alternative hypotheses for the test.
2) Determine an appropriate rejection region with a = .01.
3) Calculate the observed value of the test statistic.
4) Do the data present sufficlent evidence to indicate that populations 1 and 2 are different?
CS Scanned with CamScanner
Expert Solution
This question has been solved!
Explore an expertly crafted, step-by-step solution for a thorough understanding of key concepts.

This is a popular solution!

Trending now
This is a popular solution!

Step by step
Solved in 2 steps

Recommended textbooks for you
College Algebra (MindTap Course List)
Algebra
ISBN:
9781305652231
Author:
R. David Gustafson, Jeff Hughes
Publisher:
Cengage Learning
College Algebra (MindTap Course List)
Algebra
ISBN:
9781305652231
Author:
R. David Gustafson, Jeff Hughes
Publisher:
Cengage Learning