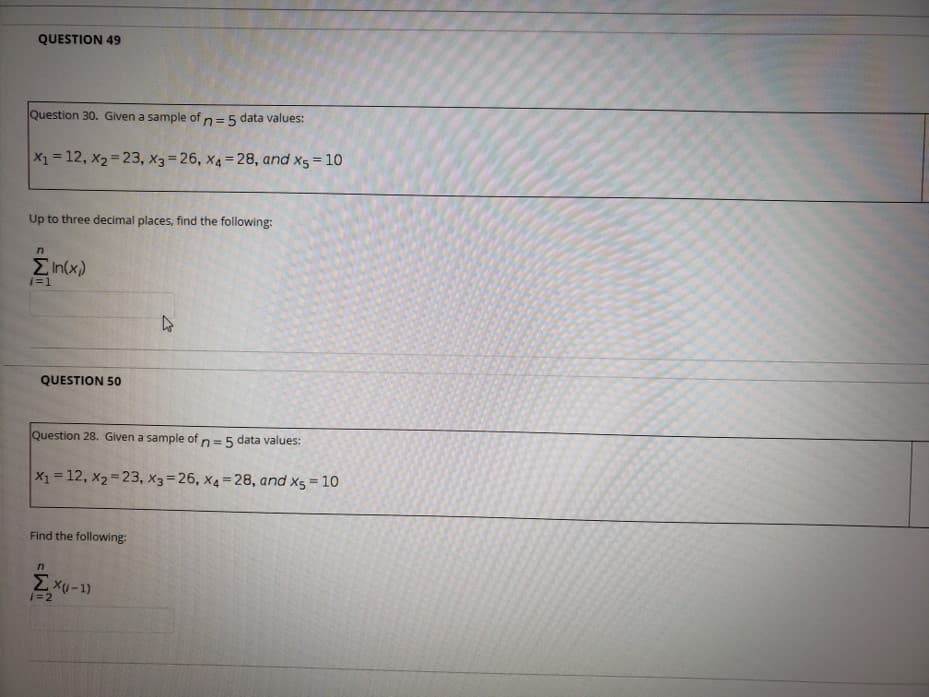
Question 30. Given a sample of n=5 data values: X1=12, x2 23, x3=26, x4=28, and xs = 10 %3D %3D Up to three decimal places, find the following: En(x) 1=1 QUESTION 50 Question 28. Given a sample of n=5 data values: X1=12, x2-23, x3= 26, x4= 28, and xs = 10 %! Find the following: Exu-1) 1-2


Q: For this experiment, it is desired to investigate the relationship between air inlet temperature and…
A: Consider the given data that contains the intel temperature (x) and the removal efficiency (y).…
Q: Question 2 A manufacturing company want to compare the yield from two engineering process. The…
A: Given data: Good Bad Total Process A 86 14 100 Process B 80 20 100 Total 166 34 200
Q: Question 2 Given the data as in Table 2. x y 2 2.757 Table 2 3 7 3.279 6.009 9 9.751 12 12.906 15…
A: Given is a data in a table 2 as x 2 3 7 9 12 15 y 2.757 3.279 6.009 9.751 12.906 15.988 To…
Q: QUESTION 10 What proportion of shoppers at a supermarket in Lebanon nowadays are actually capable of…
A: Given: Confidence level = 96% Margin of error = 10% = 0.10 Formula Used: Margin of error =…
Q: Question 4 (8 parts): A manufacturer's truck tire is designed to have a sidewall depth of 1.1 cm. If…
A: Hey there! Thank you for posting the question. Since your question has more than 3 parts, we are…
Q: Listed below are body temperatures from five different subjects measured at 8 AM and again at 12 AM.…
A: The body temperatures from five different subjects measured at 8 AM and again at 12 AM, are given.
Q: For 50 randomly selected speed dates, attractiveness ratings by males of their female date…
A: The given regression line equation is ŷ = 8.19−0.338x.
Q: QUESTION 8 According to WorldAtlas, approximately 79% of the world population has brown eyes The…
A: Let x be the no of brown eyes x=22 Total no of samples n=40 Then to find sample proportion p of…
Q: #3
A: Least squares estimators of the slope is always an unbiased estimator of the true slope in the…
Q: The following table lists the approximate number of adults (18+) who are obese (BMI ≥ 25) in North…
A: We are selecting from males, so this is a given condition. So to find the probability that a…
Q: Question 1 The following table shows the number of shirts by sizes that are manufactured in a…
A: i). Since the population size is large, therefore it is difficult to examine the entire weekly…
Q: Question 8| Q7. The medical community in the US does not have a good history of treating study…
A: Note: " Since you have asked multiple questions, we will solve the first question for you. If you…
Q: QUESTION 8 The data given in the Table below is produced from a model of the form: Y = (aX+b) s. 4 2…
A:
Q: How many murders per 100,000 residents can be expected in a state with 2.7 thousand automatic…
A: The regression equation is given by y=0.84x+4.16
Q: QUESTION 1 Suppose you estimate the following results: hourly_wage=5.5+ 0.50edu + 0.10exper+…
A:
Q: PROBLEM 5.39 The following data on degree of exposure to 242Cm alpha particles (x) and the…
A: Given the data on degree of exposure to 242Cm alpha particles (x) and the percentage of exposed…
Q: Question 3 > To estimate the percentage of households in Connecticut which use fuel oil as a heating…
A: Given that The correct option are
Q: QUESTION 1 Consider the following regression model, Yi=B1+B2X12++ BxXik+ ej E[e,x,]=0 and Varle,x)…
A: The regression model is yi=β1+β2xi2+...........+βkxik+ei where E(eixi)=0 and var(eixi) depends on…
Q: Question 6 Suppose that among 10,000 women with negative mammograms, 20 will be diagnosed with…
A: From the given information, among 10,000 women with negative mammograms, 20 will be diagnosed with…
Q: This exercise is based on the following data on four bodybuilding supplements. (Figures shown…
A:
Q: Question 2.a In order to investigate a relationship between them, which should you make the…
A: Life Expectancy (X) Index (Y) (x-xbar) (x-xbar)^2 (y-ybar) (y-ybar)^2 (x-xbar)*(y-ybar) 81 7 7.6…
Q: produced
A: 1) In this case the population size is large so it will be some difficult and take long time to…
Q: Question 8: Suppose we are interested in comparing the proportion of male students who smoke to the…
A: It is given that:- smoke=yes smoke=no…
Q: QUESTION 10 Find the critical value or values of y2 based on the given information. H1: o > 26.1 n =…
A: The provided information is: Sample size (n) = 0.01 Test is right tailed Level of significance is…
Q: Question 17-20: The following data on calcium content of wheat are consistent with summary…
A: Analysis of variance (ANOVA):- The analysis of variance is a powerful tool for the test of…
Q: Problem 3. Consider the simple regression model: Y; = Bo + B1X; + U; where X; is an endogenous…
A: Given Information: Consider the regression model: Yi=β0+β1Xi+ui Where, Xi=endogenous…
Q: QUESTION # 2 (a) A laboratory that was contracted to analyze 100 soil samples for chlordane per…
A: Given, following data are given for chlordane concentration. Method concentrations 1…
Q: Question 4 Some researchers are planning a 3-year study of cataract in a group of people 60 years of…
A: Event: In probability theory, an event is an outcome or a set of outcomes of a random experiment to…
Q: Question 3 The following table contains information on the time that each of 10 steel samples were…
A: Note:-Since you have posted a question with multiple sub-parts, we will solve first three sub- parts…
Q: QUESTION 12 Provide an appropriate response. Suppose you want to test the claim that u > 25.6. Given…
A: Given : Claim : u > 25.6
Q: Question 3 Twenty sculptors were asked to produce molds of a model using a different medium for each…
A: Given information: Subject Model Present Photo Memory 1 9 5 5 2 3 9 6 3 6 8 9 4 1 6 10…
Q: Prepare a table like the one given by using the same procedure (a) for the case in which you draw…
A: a) Given data: The given number of marbles is: 3. The below table shows the possible outcome…
Q: Question 5 Suppose we have the PRF represented as the equation In Y₁ = b + b, ln X₁, + b₂ ln X₂, +…
A:
Q: Question 2 A research study indicated a negative linear relationship between two variables: the…
A: The independent variable is Exercise time. The dependent variable is running time. The data output…
Q: question 10 Advertising You are the marketing director for a company that manufactures…
A: Let us assume that: x= Number of pages in Magazine A y = Number of pages in Magazine B Now, the…
Q: QUESTION 1 Suppose you estimate the following results: hourly_wage=5.5 +0.50edu + 0.10exper+…
A: Given that, Hourly wage=5.5+0.50edu+0.10exper+0.10(edu*exper) Standard error for beta0hat is…
Q: Question 13: A group of 5 people joined a meditation class designed to increase their energy level,…
A: The given data of 5 people are: Before 67 60 55 45 65 After 83 75 68 56 81
Q: Question 8: Consider a random sample X₁, X2, ..., X, from the pdf f(x; 0) = (0+1)xº 0≤x≤1 where 0>…
A:
Q: Question 5: The personnel director of a large company studied the work habits of employees by…
A: Observational studies are those studies in which the investigator observes and derive conclusions…
Q: Question 1…
A: Sampling: The Sample is a subset of the Population, where a sample is extracted from a…
Q: PROBLEM 5.39 The following data on degree of exposure to 242Cm alpha particles (x) and the…
A:
Q: Question 21, Multiple choice below. 21. The financial aid director of a large college reports that…
A: As per Bartleby guideline expert have to answer first 3 subparts only dear student please upload…
Q: It is important to consider the possibility of a type II error when a nonparametric test fails to…
A: In this case, we need to identify the given statement is true or not.
Q: A.)For this study, we should use Select an answer t-test for a population mean z-test for a…
A: Answer: A) For this study, we should do t-test for population mean.
Q: Question 6. For a sample of 10 observations of two independent variables X and Y, we give =5 an y =…
A: Given: x¯=5y¯=10n=10
Q: QUESTION 3 Determine whether the given percentage is a statistic or a parameter. In a study of 245…
A: We have given that in a study of 245 employees sampled from a total of 1018, it is found that 82%…
Q: Question 14.3 (Page 611) – A random sample of the following two variables was obtained: x 29 48 28…
A: For the given data Find ( a) r =? ( b ) Hypothesis test ( c ) Least square regression line
Q: Question 16. Given a sample of n=5 data values: X1 = 12, x2 23, X3 26, x4 = 28, and x5 =10 %3D Find…
A: according to our guidelines we can answer only three subparts, or first question and rest can be…
Q: Question 5 Germination of a seed commences with the uptake of water and is completed with the…
A: Given data: Germinated Not Germinated Treated 85 15 Untreated 120 30 Significance level…
Q: QUESTION 11 An express delivery service company recently conducted a study to investigate the…
A: The problem can be solved using the concept of regression. as requested, i have attached handwritten…


Trending now
This is a popular solution!

Step by step
Solved in 2 steps with 1 images


- Urban Travel Times Population of cities and driving times are related, as shown in the accompanying table, which shows the 1960 population N, in thousands, for several cities, together with the average time T, in minutes, sent by residents driving to work. City Population N Driving time T Los Angeles 6489 16.8 Pittsburgh 1804 12.6 Washington 1808 14.3 Hutchinson 38 6.1 Nashville 347 10.8 Tallahassee 48 7.3 An analysis of these data, along with data from 17 other cities in the United States and Canada, led to a power model of average driving time as a function of population. a Construct a power model of driving time in minutes as a function of population measured in thousands b Is average driving time in Pittsburgh more or less than would be expected from its population? c If you wish to move to a smaller city to reduce your average driving time to work by 25, how much smaller should the city be?Question # 5: Twenty-five army inductees in Ontario were given a blood test to determine their blood type. The data set is A B B AB O O O B AB B B B O A O A O O O AB AB A O B A Calculate the single-number estimate of the population proportion of the army inductees who got blood type O.Question 4 a The researcher is concerned that older persons may not be knowledgeable of the COFLU-20. Assuch, he is interested in investigating the association between the age of the respondents and theirknowledge level. Table 2 below shows the knowledge level of respondents, by age group.Table 2Age Group Knowledge Level TotalPoor Satisfactory Good18 - 25 33 16 13 6226 - 34 30 18 12 6035 - 44 29 14 12 5545 - 54 36 16 18 7055 - 75 17 14 22 53Total 145 78 77 300 Conduct a test, at the 5% level of significance, to determine whether the data provided sufficientevidence to conclude that an association exists between age group and knowledge level. (i) State the hypotheses to be tested:H0:H1: Calculate:(ii) state the degrees of freedom for this test (iii) the p-value for this test, given that the chi-square test statistic, x2, is 11.029. (iv) state the conclusion for the test. Give reason for your answer.
- QUESTION 4(a) The researcher is concerned that older persons may not be knowledgeable of the COFLU-20. Assuch, he is interested in investigating the association between the age of the respondents and theirknowledge level. Table 2 below shows the knowledge level of respondents, by age group.Table 2Age Group Knowledge Level TotalPoor Satisfactory Good18 - 25 33 16 13 6226 - 34 30 18 12 6035 - 44 29 14 12 5545 - 54 36 16 18 7055 - 75 17 14 22 53Total 145 78 77 300Conduct a test, at the 5% level of significance, to determine whether the data provided sufficientevidence to conclude that an association exists between age group and knowledge level.(i) State the hypotheses to be tested:H0:H1: Calculate:(ii) state the degrees of freedom for this test (iii) the p-value for this test, given that the chi-square test statistic, 2, is 11.029.(iv) state the conclusion for the test. Give reason for your answer.QUESTION FOUR The following are the variations of ratings of Five Richfield college researchers on the institutions National Innovative Research Initiative (NIRI) project for the year 2020: RATINGS 3 4 7 10 15 30 Using the data values given above, calculate the following: 4.1.1 Arithmetic mean 4.1.2 MedianQuestion 3: According to the journal Chemical Engineering, an important property of a fiber is its water absorbency. A random sample of 20 pieces of cotton fiber is taken and the absorbency on each piece was measured. The following are the absorbency values:18.71 21.41 20.72 21.81 19.29 22.43 20.17 23.71 19.44 20.50 18.92 20.33 23.00 22.85 19.25 21.77 22.11 19.77 18.04 21.12 17.89 19.63 22.85 20.49(a) Calculate the sample mean and median for the above sample values.
- Question 4: The following data includes the year, make, model, mileage (in thousands of miles) and asking price (in US dollars) for each of 13 used Honda Odyssey minivans. The data was collected from the Web site of the Seattle P-I on April 25, 2005. year make model mileage price 2004 Honda Odyssey EXL 20 26900 2004 Honda Odyssey EX 21 23000 2002 Honda Odyssey 33 17500 2002 Honda Odyssey 41 18999 2001 Honda Odyssey EX 43 17200 2001 Honda Odyssey EX 67 18995 2000 Honda Odyssey LX 46 13900 2000 Honda Odyssey EX 72 15250 2000 Honda Odyssey EX 82 13200 2000 Honda Odyssey 99 11000 1999 Honda Odyssey 71 13900 1998 Honda Odyssey 85 8350 1995 Honda Odyssey EX 100 5800 Compute the correlation between age (in years) and mileage for these minivans. (Assume the correlation conditions have been satisfied and round your answer to the nearest 0.001.)Question 1 The following table shows the number of shirts by sizes that are manufactured in a factory on a particular week: The information is as follows: Extra Small Small Medium Large Extra Large 390 470 520 680 440 a) It was discovered that the sizing of some shirts was labelled incorrectly.(i) Give two reasons why it would be necessary to examine a sample of the shirts produced rather than examine the entire weekly production. (ii) State two differences between a cluster sample and a stratified random sample in this situation. (iii) Using the stratified random sampling technique, calculate the number of medium shirts that will be selected if we require a sample of 375 shirts.Question #1 The accompanying table lists the numbers of words spoken in a day by each member of 56 different randomly selected couples. Complete parts (a) and (b) below. View the data on words spoken in a day by the couples. Words spoken in a day Male Female 28,916 19,097 17,080 23,982 5,369 5,101 28,363 17,816 25,958 10,524 8,297 16,688 20,503 12,766 15,942 18,586 26,897 11,822 22,664 18,230 11,691 17,815 11,359 12,247 11,760 16,633 19,899 24,852 20,136 4,675 583 19,210 20,966 24,220 11,870 16,819 21,854 14,898 16,588 13,262 14,299 29,193 20,147 9,699 6,488 17,425 6,670 4,257 25,126 12,358 8,885 20,050 11,650 12,185 11,007 20,530 13,225 21,563 17,576 12,187 15,501…
- QUESTION 8 Rocky Mountain National Park is a popular park for outdoor recreation activities in Colorado. According to U.S. National Park Service statistics, 46.7% of visitors to Rocky Mountain National Park in 2018 entered through the Beaver Meadows park entrance, 24.3% of visitors entered through the Fall River park entrance, 6.3% of visitors entered through the Grand Lake park entrance, and 22.7% of visitors had no recorded point of entry to the park.† Consider a random sample of 175 Rocky Mountain National Park visitors. Use the normal approximation of the binomial distribution to answer the following questions. (Round your answers to four decimal places.) (a) What is the probability that at least 85 visitors had a recorded entry through the Beaver Meadows park entrance? (b) What is the probability that at least 80 but less than 90 visitors had a recorded entry through the Beaver Meadows park entrance? (c) What is the probability that fewer than 12 visitors had a…Question(13): The researcher decided to conduct the study again and selected an additional 10 children from the full time kindergarden and an additional 10 children from partime kindergarden.This time they matched the children in full time and part time based on SES, gender, age and vocabulary scores. They based their hypotheses on the finding from a previous study and wanted to see if children who attended full time kindergarden would have better short term memory recall comparred to children who attended partime kindergarden. Researcher read a list of 20 words then waited for two minutes, as the children had snacks, then ask then to tell them as many words as the could from the list of 20 words. Those who remember got a score of 1. Here is a summary of the result. full time kindergarden: 15 9 10 8 11 7 14 12 11 13 part time kindergarden: 10 7 9 8 12 6 8 10 7 9 Test the hypothses at (alpha…Question 5: A random sample of 50 employees is chosen for a company…