Question# 4: Assume you are a realtor in Bradenton, Florida. You have recently obtained a listing of the selling prices of the homes that have sold in that area in the last 6 months. You wish to organize those data so you will be able to provide potential buyers with useful information. Use the following data to create a histogram, frequency polygon, and cumulative frequency polygon (create frequency distribution table for 5 classes). 142,000 127,000 99,600 162,000 89,000 93,000 99,500 73,800 135,000 119,500 67,900 156,300 104,500 108,650 123,000 91,000 205,000 110,000 156,300 104,000 133,900 179,000 112,000 147,000 321,550 87,900 88,400 180,000 159,400 205,300 144,400 163,000 96,000 81,000 131,000 114,000 119,600 93,000 123,000 187,000 96,000 80,000 231,000 189,500 177,600 83,400o 77,000 132,300 166,000
Question# 4: Assume you are a realtor in Bradenton, Florida. You have recently obtained a listing of the selling prices of the homes that have sold in that area in the last 6 months. You wish to organize those data so you will be able to provide potential buyers with useful information. Use the following data to create a histogram, frequency polygon, and cumulative frequency polygon (create frequency distribution table for 5 classes). 142,000 127,000 99,600 162,000 89,000 93,000 99,500 73,800 135,000 119,500 67,900 156,300 104,500 108,650 123,000 91,000 205,000 110,000 156,300 104,000 133,900 179,000 112,000 147,000 321,550 87,900 88,400 180,000 159,400 205,300 144,400 163,000 96,000 81,000 131,000 114,000 119,600 93,000 123,000 187,000 96,000 80,000 231,000 189,500 177,600 83,400o 77,000 132,300 166,000

Glencoe Algebra 1, Student Edition, 9780079039897, 0079039898, 2018
18th Edition
ISBN:9780079039897
Author:Carter
Publisher:Carter
Chapter10: Statistics
Section10.6: Summarizing Categorical Data
Problem 4BGP

Related questions
Question
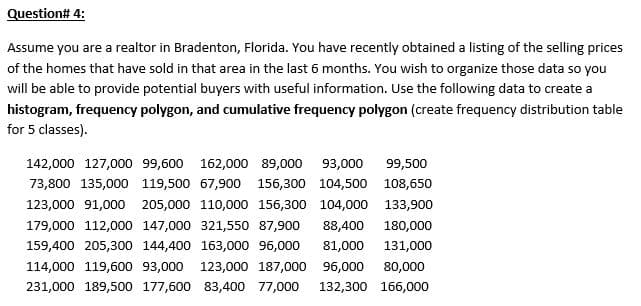
Transcribed Image Text:Question# 4:
Assume you are a realtor in Bradenton, Florida. You have recently obtained a listing of the selling prices
of the homes that have sold in that area in the last 6 months. You wish to organize those data so you
will be able to provide potential buyers with useful information. Use the following data to create a
histogram, frequency polygon, and cumulative frequency polygon (create frequency distribution table
for 5 classes).
142,000 127,000 99,600 162,000 89,000 93,000
99,500
73,800 135,000 119,500 67,900 156,300 104,500 108,650
123,000 91,000 205,000 110,000 156,300 104,000 133,900
179,000 112,000 147,000 321,550 87,900
88,400
180,000
159,400 205,300 144,400 163,000 96,000
81,000
131,000
114,000 119,600 93,000 123,000 187,000 96,000
80,000
231,000 189,500 177,600 83,400 77,000
132,300 166,000
Expert Solution
This question has been solved!
Explore an expertly crafted, step-by-step solution for a thorough understanding of key concepts.

This is a popular solution!

Trending now
This is a popular solution!

Step by step
Solved in 4 steps with 3 images

Knowledge Booster


Learn more about
Need a deep-dive on the concept behind this application? Look no further. Learn more about this topic, statistics and related others by exploring similar questions and additional content below.Recommended textbooks for you
Glencoe Algebra 1, Student Edition, 9780079039897…
Algebra
ISBN:
9780079039897
Author:
Carter
Publisher:
McGraw Hill
Glencoe Algebra 1, Student Edition, 9780079039897…
Algebra
ISBN:
9780079039897
Author:
Carter
Publisher:
McGraw Hill