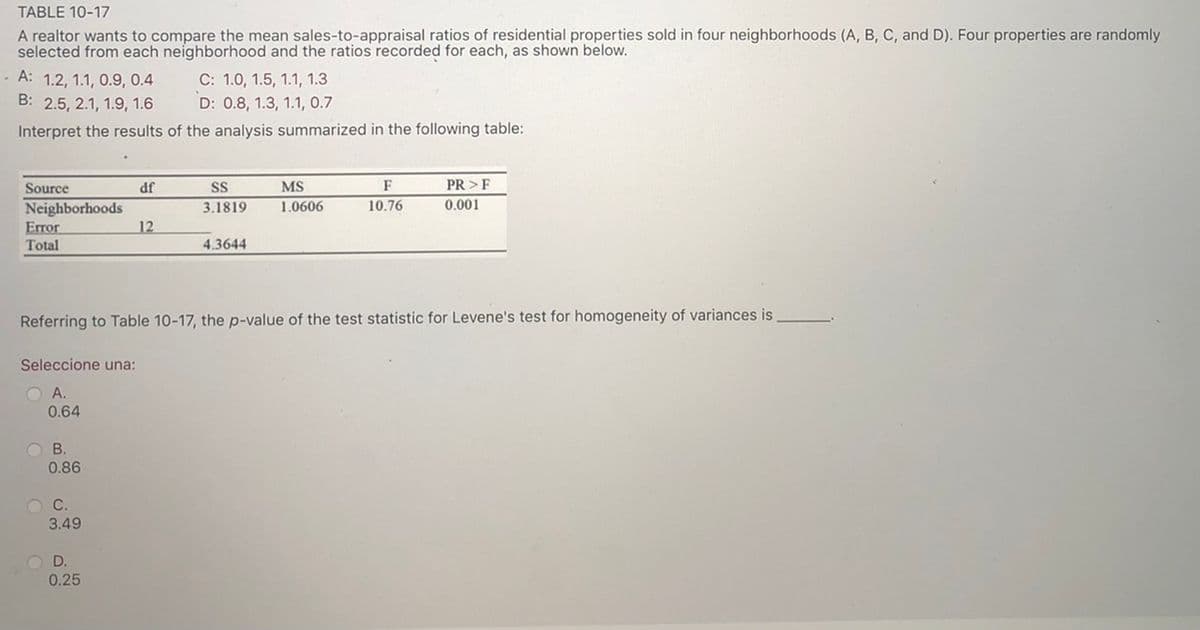
TABLE 10-17 A realtor wants to compare the mean sales-to-appraisal ratios of residential properties sold in four neighborhoods (A, B, C, and D). Four properties are randomly selected from each neighborhood and the ratios recorded for each, as shown below. A: 1.2, 1.1, 0.9, 0.4 B: 2.5, 2.1, 1.9, 1.6 C: 1.0, 1.5, 1.1, 1.3 D: 0.8, 1.3, 1.1, 0.7 Interpret the results of the analysis summarized in the following table: Source df SS MS F PR >F 1.0606 Neighborhoods Error Total 3.1819 10,76 0,001 12 4.3644 Referring to Table 10-17, the p-value of the test statistic for Levene's test for homogeneity of variances is Seleccione una: OA. 0.64 O B. 0.86 O C. 3.49 OD. 0.25


Inverse Normal Distribution
The method used for finding the corresponding z-critical value in a normal distribution using the known probability is said to be an inverse normal distribution. The inverse normal distribution is a continuous probability distribution with a family of two parameters.
Mean, Median, Mode
It is a descriptive summary of a data set. It can be defined by using some of the measures. The central tendencies do not provide information regarding individual data from the dataset. However, they give a summary of the data set. The central tendency or measure of central tendency is a central or typical value for a probability distribution.
Z-Scores
A z-score is a unit of measurement used in statistics to describe the position of a raw score in terms of its distance from the mean, measured with reference to standard deviation from the mean. Z-scores are useful in statistics because they allow comparison between two scores that belong to different normal distributions.


Trending now
This is a popular solution!

Step by step
Solved in 2 steps with 2 images


