Question #4: Using the following graph to answer the following questions: 100 MC ATC AVC 1,000 2.000 3,00 4.000 5,000 MC is marginal cost, MR is marginal revenue, ATC is average total cost, AVC is average variable cost and D is the demand curve. a. By looking at this graph, what can you say about the market power of this firm? Is it a perfect competition or a monopoly? Explain. b. To maximize the profit, how many units should the firm produce? At what price? c. Based on your answer, what is the total revenue? Total costs? Total profit? Total fixed cost? d. Will you operate this firm in the short run? Long run? Briefly explain. e. How do you measure monopoly power? smop oo pue senuna
Question #4: Using the following graph to answer the following questions: 100 MC ATC AVC 1,000 2.000 3,00 4.000 5,000 MC is marginal cost, MR is marginal revenue, ATC is average total cost, AVC is average variable cost and D is the demand curve. a. By looking at this graph, what can you say about the market power of this firm? Is it a perfect competition or a monopoly? Explain. b. To maximize the profit, how many units should the firm produce? At what price? c. Based on your answer, what is the total revenue? Total costs? Total profit? Total fixed cost? d. Will you operate this firm in the short run? Long run? Briefly explain. e. How do you measure monopoly power? smop oo pue senuna

Chapter9: Monopoly
Section: Chapter Questions
Problem 6SQP

Related questions
Question
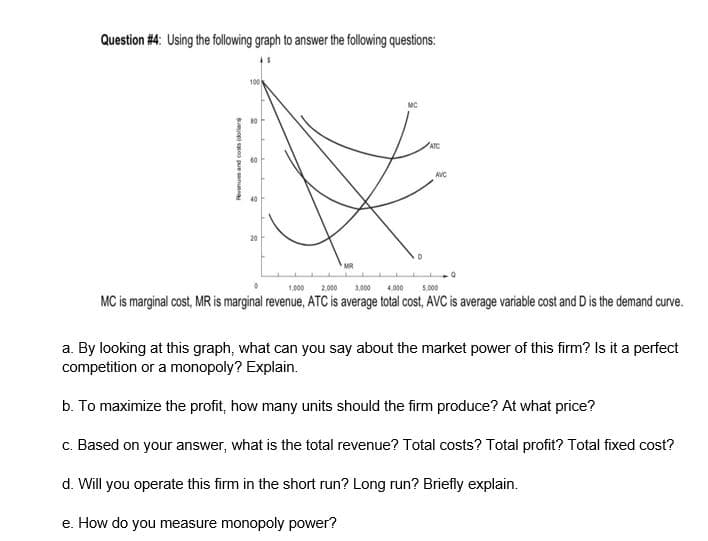
Transcribed Image Text:Question #4: Using the following graph to answer the following questions:
100
MC
ATC
AVC
1,000
2.000
3,00
4.000
5,000
MC is marginal cost, MR is marginal revenue, ATC is average total cost, AVC is average variable cost and Dis the demand curve.
a. By looking at this graph, what can you say about the market power of this firm? Is it a perfect
competition or a monopoly? Explain.
b. To maximize the profit, how many units should the firm produce? At what price?
c. Based on your answer, what is the total revenue? Total costs? Total profit? Total fixed cost?
d. Will you operate this firm in the short run? Long run? Briefly explain.
e. How do you measure monopoly power?
smopi oo pue senuna
Expert Solution
This question has been solved!
Explore an expertly crafted, step-by-step solution for a thorough understanding of key concepts.

Step by step
Solved in 2 steps

Knowledge Booster


Learn more about
Need a deep-dive on the concept behind this application? Look no further. Learn more about this topic, economics and related others by exploring similar questions and additional content below.Recommended textbooks for you


Exploring Economics
Economics
ISBN:
9781544336329
Author:
Robert L. Sexton
Publisher:
SAGE Publications, Inc

