Question 4: Rivers in North Carolina contain small concentrations of mercury that can accumulate in fish over their lifetimes. The concentration of mercury in fish tissue can be obtained by catching fish and sending samples to a lab for analysis. A study was conducted on fish from the Waccamaw and Lumber Rivers to investigate mercury levels in tissues of largemouth bass. At several stations along each river a group of fish were caught, weighed and measured; in addition a filet from each fish was sent to a lab so that the tissue concentration of mercury could be determined. In all, 171 fish were caught at 15 different research stations along the Waccamaw and Lumber Rivers. Data from fish caught at one of these stations is shown in the following table: length weight 1616 47.0 1862 48.7 2855 55.7 1199 45.2 1320 44.7 1225 43.8 870 38.5 1455 45.8 1220 44.0 1033 40.4 Compute the correlation between length and weight for these fish


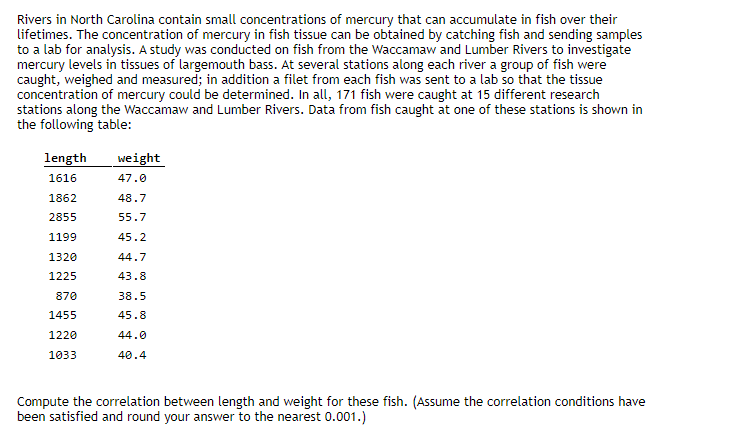
Question 4: Rivers in North Carolina contain small concentrations of mercury that can accumulate in fish over their lifetimes. The concentration of mercury in fish tissue can be obtained by catching fish and sending samples to a lab for analysis. A study was conducted on fish from the Waccamaw and Lumber Rivers to investigate mercury levels in tissues of largemouth bass. At several stations along each river a group of fish were caught, weighed and measured; in addition a filet from each fish was sent to a lab so that the tissue concentration of mercury could be determined. In all, 171 fish were caught at 15 different research stations along the Waccamaw and Lumber Rivers. Data from fish caught at one of these stations is shown in the following table:
| length | weight |
| 1616 | 47.0 |
| 1862 | 48.7 |
| 2855 | 55.7 |
| 1199 | 45.2 |
| 1320 | 44.7 |
| 1225 | 43.8 |
| 870 | 38.5 |
| 1455 | 45.8 |
| 1220 | 44.0 |
| 1033 | 40.4 |
Compute the


Trending now
This is a popular solution!

Step by step
Solved in 3 steps with 2 images


