a. What is the value of the test statistic (round to 2 decimals)? b. What is the p-value (round to 4 decimals)? Use z-value rounded to 2 decimal places. X c. With a = 0.05, what is your hypothesis testing conclusion? p-value is less than or equal to 0.05, reject Ho
a. What is the value of the test statistic (round to 2 decimals)? b. What is the p-value (round to 4 decimals)? Use z-value rounded to 2 decimal places. X c. With a = 0.05, what is your hypothesis testing conclusion? p-value is less than or equal to 0.05, reject Ho

MATLAB: An Introduction with Applications
6th Edition
ISBN:9781119256830
Author:Amos Gilat
Publisher:Amos Gilat
Chapter1: Starting With Matlab
Section: Chapter Questions
Problem 1P

Related questions
Question
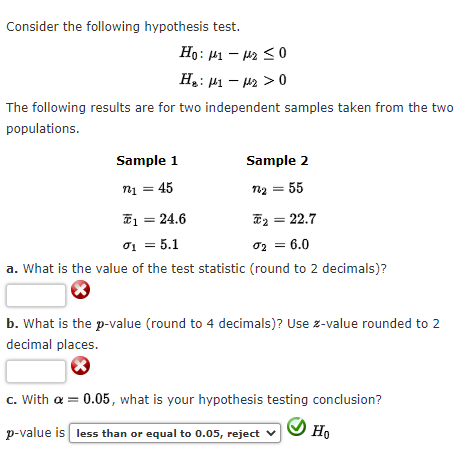
Transcribed Image Text:Consider the following hypothesis test.
Ho: 1-₂ ≤0
H₂: μ1 −μ₂ > 0
The following results are for two independent samples taken from the two
populations.
Sample 1
Sample 2
n₁ = 45
12₂ = 55
*₂ = 22.7
0₁ = 5.1
0₂ = 6.0
a. What is the value of the test statistic (round to 2 decimals)?
b. What is the p-value (round to 4 decimals)? Use z-value rounded to 2
decimal places.
c. With a = 0.05, what is your hypothesis testing conclusion?
p-value is less than or equal to 0.05, reject
Ho
1 = 24.6
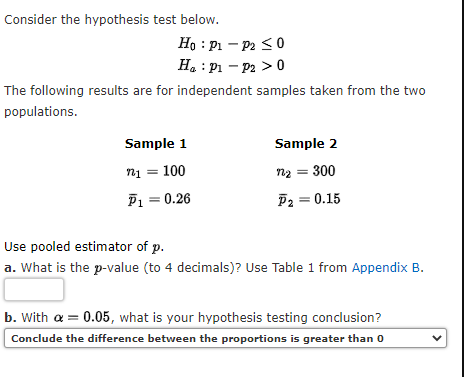
Transcribed Image Text:Consider the hypothesis test below.
Ho: P₁
P2 ≤0
H₂ : P₁ - P2 > 0
The following results are for independent samples taken from the two
populations.
Sample 1
Sample 2
n₁ = 100
n1
n₂ = 300
P₁ = 0.26
P2 = 0.15
Use pooled estimator of p.
a. What is the p-value (to 4 decimals)? Use Table 1 from Appendix B.
b. With a = 0.05, what is your hypothesis testing conclusion?
Conclude the difference between the proportions is greater than 0
Expert Solution
This question has been solved!
Explore an expertly crafted, step-by-step solution for a thorough understanding of key concepts.

This is a popular solution!

Trending now
This is a popular solution!

Step by step
Solved in 2 steps

Recommended textbooks for you
MATLAB: An Introduction with Applications
Statistics
ISBN:
9781119256830
Author:
Amos Gilat
Publisher:
John Wiley & Sons Inc

Probability and Statistics for Engineering and th…
Statistics
ISBN:
9781305251809
Author:
Jay L. Devore
Publisher:
Cengage Learning

Statistics for The Behavioral Sciences (MindTap C…
Statistics
ISBN:
9781305504912
Author:
Frederick J Gravetter, Larry B. Wallnau
Publisher:
Cengage Learning
MATLAB: An Introduction with Applications
Statistics
ISBN:
9781119256830
Author:
Amos Gilat
Publisher:
John Wiley & Sons Inc
Probability and Statistics for Engineering and th…
Statistics
ISBN:
9781305251809
Author:
Jay L. Devore
Publisher:
Cengage Learning
Statistics for The Behavioral Sciences (MindTap C…
Statistics
ISBN:
9781305504912
Author:
Frederick J Gravetter, Larry B. Wallnau
Publisher:
Cengage Learning

Elementary Statistics: Picturing the World (7th E…
Statistics
ISBN:
9780134683416
Author:
Ron Larson, Betsy Farber
Publisher:
PEARSON

The Basic Practice of Statistics
Statistics
ISBN:
9781319042578
Author:
David S. Moore, William I. Notz, Michael A. Fligner
Publisher:
W. H. Freeman

Introduction to the Practice of Statistics
Statistics
ISBN:
9781319013387
Author:
David S. Moore, George P. McCabe, Bruce A. Craig
Publisher:
W. H. Freeman