Question 5 Find the median for the given sample data. In ten trips to Las Vegas, a person had the following net gains: $1577 $3251 $4364 $6961 $3385 $1162 $6757 SS181 $6062 $4560 Find the median net gain. O $4364 O $5141.06 O $4626.50 O $4462.00
Question 5 Find the median for the given sample data. In ten trips to Las Vegas, a person had the following net gains: $1577 $3251 $4364 $6961 $3385 $1162 $6757 SS181 $6062 $4560 Find the median net gain. O $4364 O $5141.06 O $4626.50 O $4462.00

Glencoe Algebra 1, Student Edition, 9780079039897, 0079039898, 2018
18th Edition
ISBN:9780079039897
Author:Carter
Publisher:Carter
Chapter10: Statistics
Section10.6: Summarizing Categorical Data
Problem 4BGP

Related questions
Question
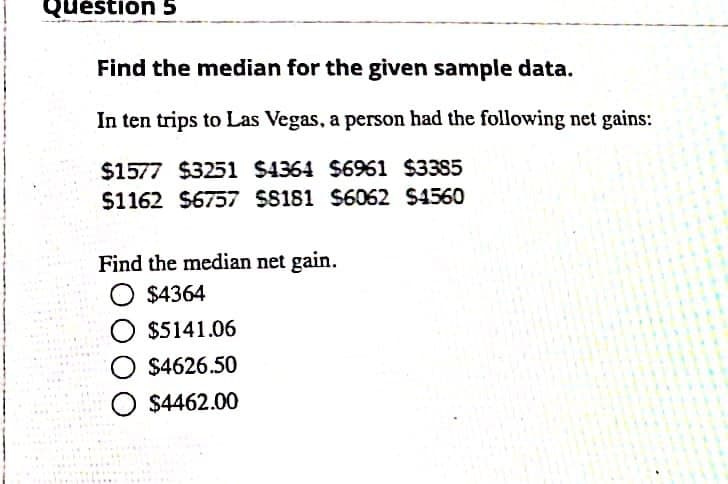
Transcribed Image Text:Quéstión 5
Find the median for the given sample data.
In ten trips to Las Vegas, a person had the following net gains:
$1577 $3251 $4364 $6961 $3385
$1162 $6757 $S181 S6062 $4560
Find the median net gain.
O $4364
O $5141.06
O $4626.50
O $4462.00
Expert Solution
This question has been solved!
Explore an expertly crafted, step-by-step solution for a thorough understanding of key concepts.

This is a popular solution!

Trending now
This is a popular solution!

Step by step
Solved in 2 steps with 2 images

Recommended textbooks for you
Glencoe Algebra 1, Student Edition, 9780079039897…
Algebra
ISBN:
9780079039897
Author:
Carter
Publisher:
McGraw Hill
Glencoe Algebra 1, Student Edition, 9780079039897…
Algebra
ISBN:
9780079039897
Author:
Carter
Publisher:
McGraw Hill