QUESTION 20 Determine which type of chart is the most appropriate representation for the following data : The distribution of 100 students in the following ranges 35-39 kilos, 40-44 kilos, 45-49 kilos, 50-54 kilos, and 55-59 kilos. Column Chart Histogram Pie Chart Line Chart
QUESTION 20 Determine which type of chart is the most appropriate representation for the following data : The distribution of 100 students in the following ranges 35-39 kilos, 40-44 kilos, 45-49 kilos, 50-54 kilos, and 55-59 kilos. Column Chart Histogram Pie Chart Line Chart

Glencoe Algebra 1, Student Edition, 9780079039897, 0079039898, 2018
18th Edition
ISBN:9780079039897
Author:Carter
Publisher:Carter
Chapter10: Statistics
Section: Chapter Questions
Problem 7MCQ

Related questions
Question
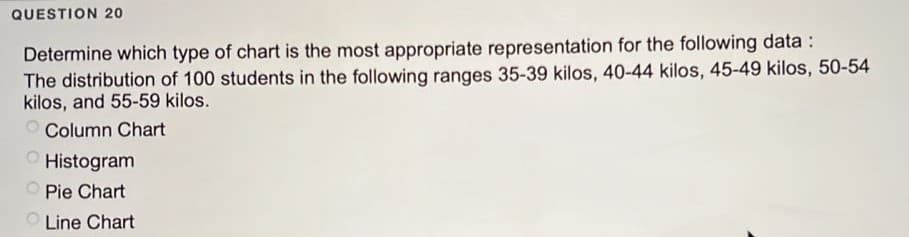
Transcribed Image Text:QUESTION 20
Determine which type of chart is the most appropriate representation for the following data :
The distribution of 100 students in the following ranges 35-39 kilos, 40-44 kilos, 45-49 kilos, 50-54
kilos, and 55-59 kilos.
Column Chart
Histogram
Pie Chart
Line Chart
Expert Solution
This question has been solved!
Explore an expertly crafted, step-by-step solution for a thorough understanding of key concepts.

Step by step
Solved in 2 steps

Recommended textbooks for you
Glencoe Algebra 1, Student Edition, 9780079039897…
Algebra
ISBN:
9780079039897
Author:
Carter
Publisher:
McGraw Hill

Holt Mcdougal Larson Pre-algebra: Student Edition…
Algebra
ISBN:
9780547587776
Author:
HOLT MCDOUGAL
Publisher:
HOLT MCDOUGAL
Glencoe Algebra 1, Student Edition, 9780079039897…
Algebra
ISBN:
9780079039897
Author:
Carter
Publisher:
McGraw Hill
Holt Mcdougal Larson Pre-algebra: Student Edition…
Algebra
ISBN:
9780547587776
Author:
HOLT MCDOUGAL
Publisher:
HOLT MCDOUGAL