QUESTION 18 The number of words that a typıst can type per minute iIs an example of a 1 quantitative variable, discrete data 2 qualitative variable, continuous data 3 quantitative variable, continuous data 4 qualitative variable, discrete data 5 qualitative data varıable
QUESTION 18 The number of words that a typıst can type per minute iIs an example of a 1 quantitative variable, discrete data 2 qualitative variable, continuous data 3 quantitative variable, continuous data 4 qualitative variable, discrete data 5 qualitative data varıable

Glencoe Algebra 1, Student Edition, 9780079039897, 0079039898, 2018
18th Edition
ISBN:9780079039897
Author:Carter
Publisher:Carter
Chapter10: Statistics
Section10.3: Measures Of Spread
Problem 1GP

Related questions

Question
Transcribed Image Text:/C:/Users/Hloniphile/Downloads/Telegram%20Desktop/STA1510-2019-10-E-1.pdf
4 96 1011 S pu 97 8989
5 96 5062 S u 974938
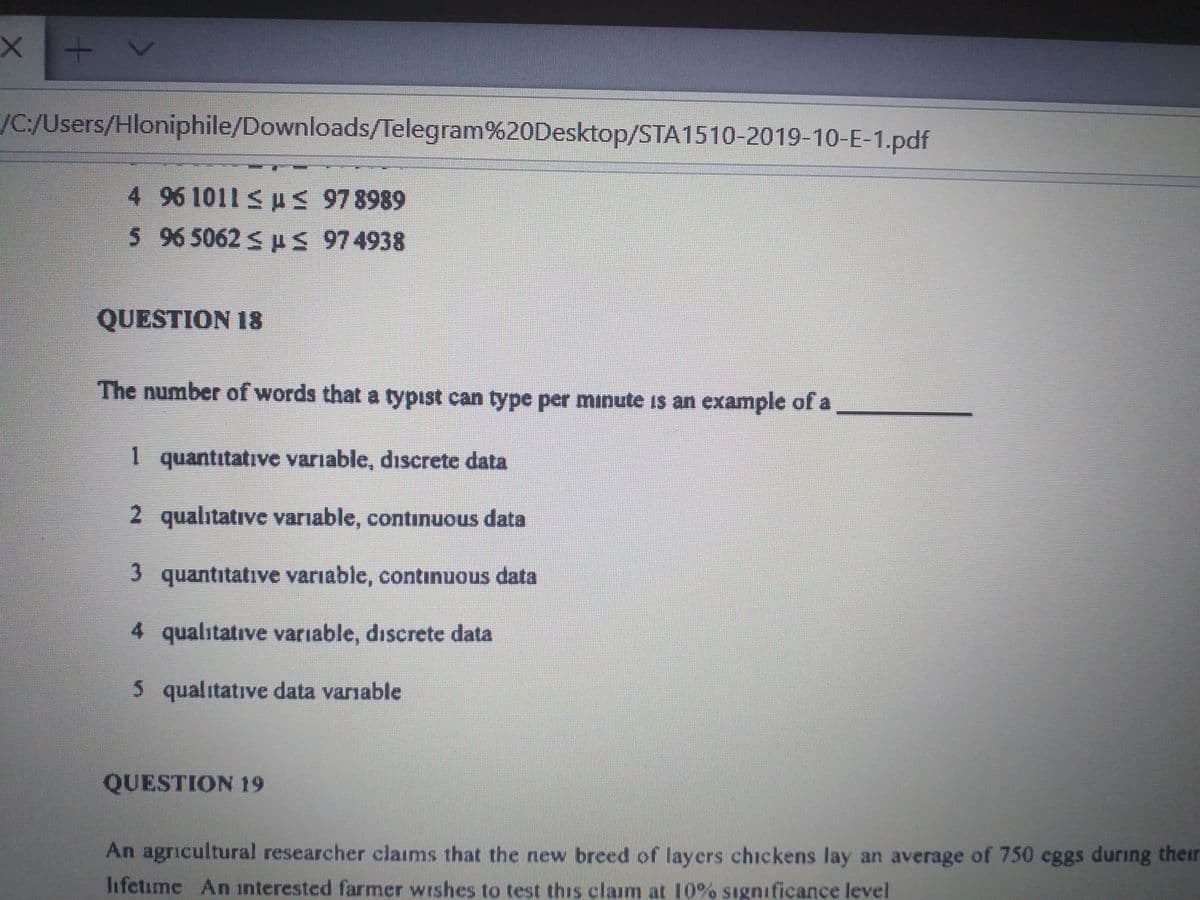
QUESTION 18
The number of words that a typıst can type per minute is an example of a
1 quantitative variable, discrete data
2 qualitative variable, continuous data
3 quantitative varıable, contınuous data
4 qualitative variable, discrete data
5 qualitative data variable
QUESTION 19
An agricultural researcher claims that the new breed of layers chickens lay an average of 750 eggs during their
Iifetime An interested farmer wishes to test this claim at 10% sıgnıficance level
Expert Solution
This question has been solved!
Explore an expertly crafted, step-by-step solution for a thorough understanding of key concepts.

This is a popular solution!

Trending now
This is a popular solution!

Step by step
Solved in 2 steps

Knowledge Booster


Learn more about
Need a deep-dive on the concept behind this application? Look no further. Learn more about this topic, statistics and related others by exploring similar questions and additional content below.Recommended textbooks for you
Glencoe Algebra 1, Student Edition, 9780079039897…
Algebra
ISBN:
9780079039897
Author:
Carter
Publisher:
McGraw Hill
Glencoe Algebra 1, Student Edition, 9780079039897…
Algebra
ISBN:
9780079039897
Author:
Carter
Publisher:
McGraw Hill