Question 8 Consider the following graphs, where the left plot is the likelihood fx|e(x|0), and the right plot is the prior fo(0). The random variable X denotes the observation. Find the MAP estimate of 0. fx|e(x|0) fe(0) 0.5 0.5 0.4 0.4 - 0.3 0.3 - 0.2 0.2 0.1 0.1 1 2 3 4 1 2 3 4
Question 8 Consider the following graphs, where the left plot is the likelihood fx|e(x|0), and the right plot is the prior fo(0). The random variable X denotes the observation. Find the MAP estimate of 0. fx|e(x|0) fe(0) 0.5 0.5 0.4 0.4 - 0.3 0.3 - 0.2 0.2 0.1 0.1 1 2 3 4 1 2 3 4

Algebra & Trigonometry with Analytic Geometry
13th Edition
ISBN:9781133382119
Author:Swokowski
Publisher:Swokowski
Chapter10: Sequences, Series, And Probability
Section10.8: Probability
Problem 29E

Related questions
Question
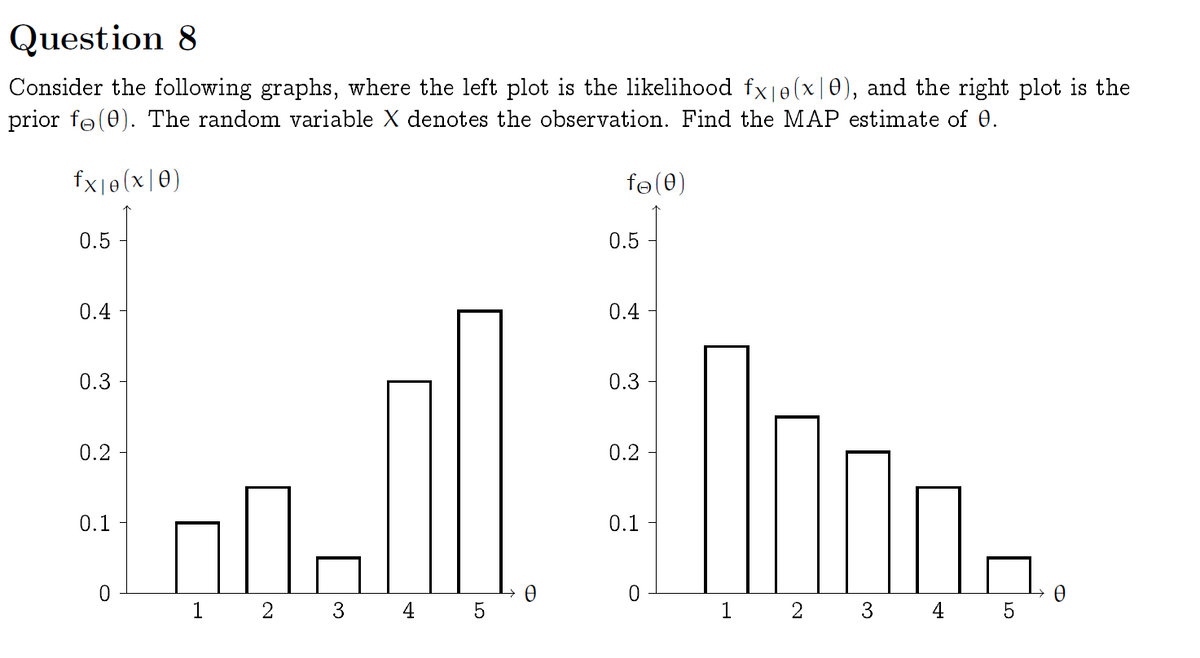
Transcribed Image Text:Question 8
Consider the following graphs, where the left plot is the likelihood fx|e(x|0), and the right plot is the
prior fo(0). The random variable X denotes the observation. Find the MAP estimate of 0.
fx|e(x|0)
fe(0)
0.5
0.5
0.4
0.4
0.3
0.3
0.2
0.2
0.1
0.1
1 2 3 4 5
1 2 3 4 5
Transcribed Image Text:Question 10
In this question we explore the application of MAP and LMS estimation in a communication channel.
Suppose we want to send a signal X, but this is corrupted by additive noise N such that the signal
at the receiver is Y, where
Y = X+ N.
We assume the noise is Gaussian with zero mean and a known variance, i.e.,
N ~ N(0, 0²).
We further assume that X is a continuous random variable with half of the probability clustered at
+1 and half of the probability clustered at –1. (We say this, instead of calling X a discrete random
variable, is so that the estimate does not necessarily have to be ±1. We can formalize it in more rigorous
mathematics using a delta function, but that is beyond the scope of this class.)
1. Find the MAP estimate of X.
2. Find the LMS estimate of X.
Expert Solution
This question has been solved!
Explore an expertly crafted, step-by-step solution for a thorough understanding of key concepts.

Step by step
Solved in 2 steps with 2 images

Recommended textbooks for you
Algebra & Trigonometry with Analytic Geometry
Algebra
ISBN:
9781133382119
Author:
Swokowski
Publisher:
Cengage

Glencoe Algebra 1, Student Edition, 9780079039897…
Algebra
ISBN:
9780079039897
Author:
Carter
Publisher:
McGraw Hill
Algebra & Trigonometry with Analytic Geometry
Algebra
ISBN:
9781133382119
Author:
Swokowski
Publisher:
Cengage
Glencoe Algebra 1, Student Edition, 9780079039897…
Algebra
ISBN:
9780079039897
Author:
Carter
Publisher:
McGraw Hill