urmber of weeks a worker is unerriployed due to a layoir (Onempioy) and Giveri below are resuits fromi the dummy variable for management position (Manager: 1= yes, 0 = no). The results of the regression analysis are given below. regression analysis wriere trhe dependent employed due layoir (Unermiploy) pendent vanabies are the age of the worker (Age) and E Click the icon to view the results. Determine whether the following statement is true or false: There is sufficient evidence that age has an effect on the number of weeks a worker is unemployed due to a layoff while holding constant the effect of the other independ variable at a 10% level of significance. - X Regression Statistics False O True Regression Statistics Multiple R 0.6391 RSquare 0.4085 Adjusted R Square 0.3765 Standard Error 18.8929 Observations 40 ANOVA df SS MS Significance F Regression 9119.0897 4559.5448 12.7740 0.0000 Residual 37 13206.8103 356.9408 Total 39 22325.9 Standard Error P-value t Stat -0.0185 Coefficients Intercept -0.2143 11.5796 0.9853 Age Manager 1.4448 0.3160 4.5717 0.0000 -22.5761 11.3488 -1.9893 0.0541
urmber of weeks a worker is unerriployed due to a layoir (Onempioy) and Giveri below are resuits fromi the dummy variable for management position (Manager: 1= yes, 0 = no). The results of the regression analysis are given below. regression analysis wriere trhe dependent employed due layoir (Unermiploy) pendent vanabies are the age of the worker (Age) and E Click the icon to view the results. Determine whether the following statement is true or false: There is sufficient evidence that age has an effect on the number of weeks a worker is unemployed due to a layoff while holding constant the effect of the other independ variable at a 10% level of significance. - X Regression Statistics False O True Regression Statistics Multiple R 0.6391 RSquare 0.4085 Adjusted R Square 0.3765 Standard Error 18.8929 Observations 40 ANOVA df SS MS Significance F Regression 9119.0897 4559.5448 12.7740 0.0000 Residual 37 13206.8103 356.9408 Total 39 22325.9 Standard Error P-value t Stat -0.0185 Coefficients Intercept -0.2143 11.5796 0.9853 Age Manager 1.4448 0.3160 4.5717 0.0000 -22.5761 11.3488 -1.9893 0.0541

Functions and Change: A Modeling Approach to College Algebra (MindTap Course List)
6th Edition
ISBN:9781337111348
Author:Bruce Crauder, Benny Evans, Alan Noell
Publisher:Bruce Crauder, Benny Evans, Alan Noell
Chapter3: Straight Lines And Linear Functions
Section3.CR: Chapter Review Exercises
Problem 15CR: Life Expectancy The following table shows the average life expectancy, in years, of a child born in...

Related questions
Question
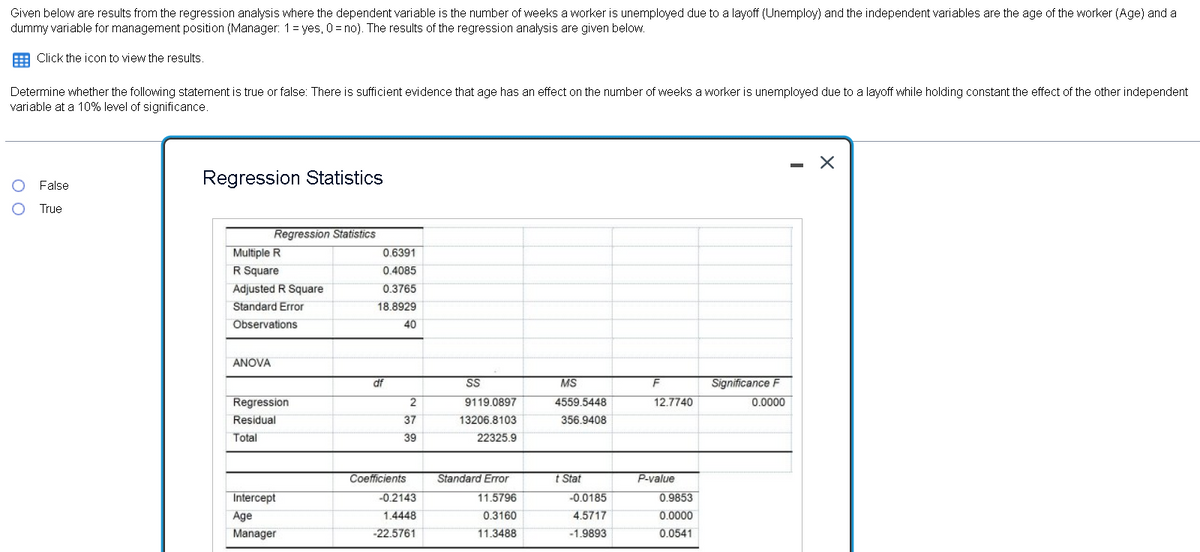
Transcribed Image Text:Given below are results from the regression analysis where the dependent variable is the number of weeks a worker is unemployed due to a layoff (Unemploy) and the independent variables are the age of the worker (Age) and a
dummy variable for management position (Manager: 1 = yes, 0 = no). The results of the regression analysis are given below.
Click the icon to view the results.
Determine whether the following statement is true or false: There is sufficient evidence that age has an effect on the number of weeks a worker is unemployed due to a layoff while holding constant the effect of the other independent
variable at a 10% level of significance.
Regression Statistics
False
True
Regression Statistics
Multiple R
0.6391
R Square
0.4085
Adjusted R Square
0.3765
Standard Error
18.8929
Observations
40
ANOVA
df
SS
MS
Significance F
Regression
2
9119.0897
4559.5448
12.7740
0.0000
Residual
37
13206.8103
356.9408
Total
39
22325.9
Coefficients
Standard Error
t Stat
P-value
Intercept
-0.2143
11.5796
-0.0185
0.9853
Age
1.4448
0.3160
4.5717
0.0000
Manager
-22.5761
11.3488
-1.9893
0.0541
Expert Solution
This question has been solved!
Explore an expertly crafted, step-by-step solution for a thorough understanding of key concepts.

This is a popular solution!

Trending now
This is a popular solution!

Step by step
Solved in 2 steps

Recommended textbooks for you
Functions and Change: A Modeling Approach to Coll…
Algebra
ISBN:
9781337111348
Author:
Bruce Crauder, Benny Evans, Alan Noell
Publisher:
Cengage Learning


Functions and Change: A Modeling Approach to Coll…
Algebra
ISBN:
9781337111348
Author:
Bruce Crauder, Benny Evans, Alan Noell
Publisher:
Cengage Learning

Glencoe Algebra 1, Student Edition, 9780079039897…
Algebra
ISBN:
9780079039897
Author:
Carter
Publisher:
McGraw Hill

Algebra and Trigonometry (MindTap Course List)
Algebra
ISBN:
9781305071742
Author:
James Stewart, Lothar Redlin, Saleem Watson
Publisher:
Cengage Learning