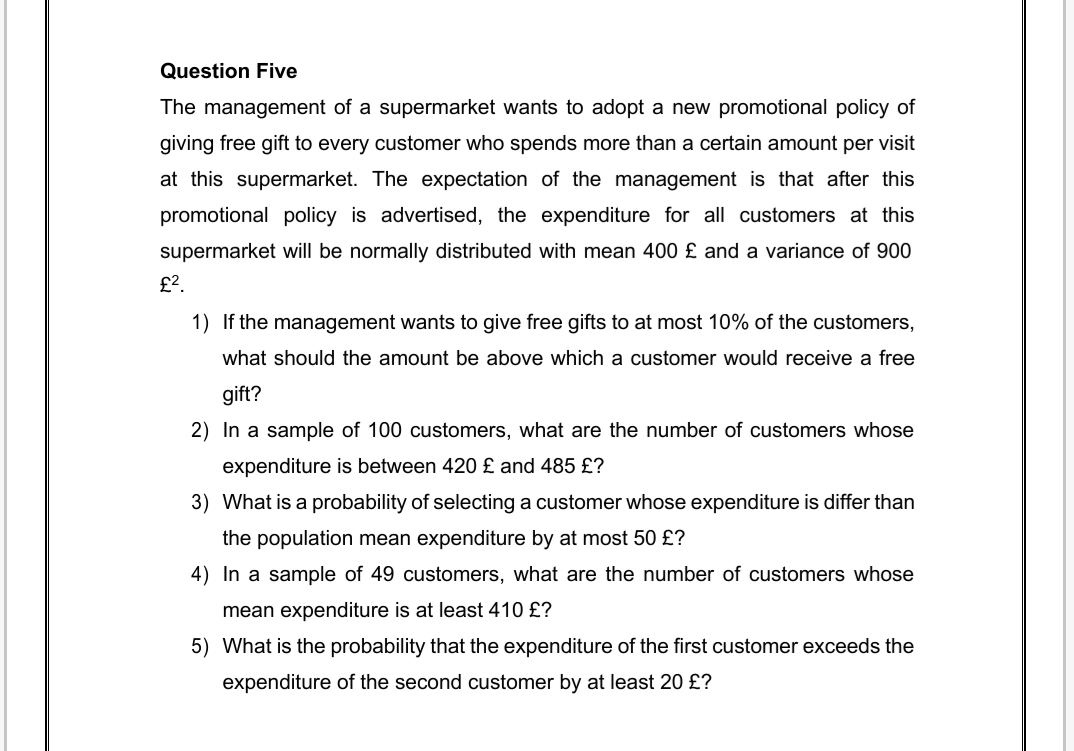
Question Five The management of a supermarket wants to adopt a new promotional policy of giving free gift to every customer who spends more than a certain amount per visit at this supermarket. The expectation of the management is that after this promotional policy is advertised, the expenditure for all customers at this supermarket will be normally distributed with mean 400 £ and a variance of 900 £?. 1) If the management wants to give free gifts to at most 10% of the customers, what should the amount be above which a customer would receive a free gift? 2) In a sample of 100 customers, what are the number of customers whose expenditure is between 420 £ and 485 £? 3) What is a probability of selecting a customer whose expenditure is differ than the population mean expenditure by at most 50 £? 4) In a sample of 49 customers, what are the number of customers whose mean expenditure is at least 410 £? 5) What is the probability that the expenditure of the first customer exceeds the expenditure of the second customer by at least 20 £?
Question Five The management of a supermarket wants to adopt a new promotional policy of giving free gift to every customer who spends more than a certain amount per visit at this supermarket. The expectation of the management is that after this promotional policy is advertised, the expenditure for all customers at this supermarket will be normally distributed with mean 400 £ and a variance of 900 £?. 1) If the management wants to give free gifts to at most 10% of the customers, what should the amount be above which a customer would receive a free gift? 2) In a sample of 100 customers, what are the number of customers whose expenditure is between 420 £ and 485 £? 3) What is a probability of selecting a customer whose expenditure is differ than the population mean expenditure by at most 50 £? 4) In a sample of 49 customers, what are the number of customers whose mean expenditure is at least 410 £? 5) What is the probability that the expenditure of the first customer exceeds the expenditure of the second customer by at least 20 £?

MATLAB: An Introduction with Applications
6th Edition
ISBN:9781119256830
Author:Amos Gilat
Publisher:Amos Gilat
Chapter1: Starting With Matlab
Section: Chapter Questions
Problem 1P

Related questions

Concept explainers
Contingency Table
A contingency table can be defined as the visual representation of the relationship between two or more categorical variables that can be evaluated and registered. It is a categorical version of the scatterplot, which is used to investigate the linear relationship between two variables. A contingency table is indeed a type of frequency distribution table that displays two variables at the same time.
Binomial Distribution
Binomial is an algebraic expression of the sum or the difference of two terms. Before knowing about binomial distribution, we must know about the binomial theorem.
Topic Video
Question
Answer number 3
And number 4
And number 5
Transcribed Image Text:TABLE D.1
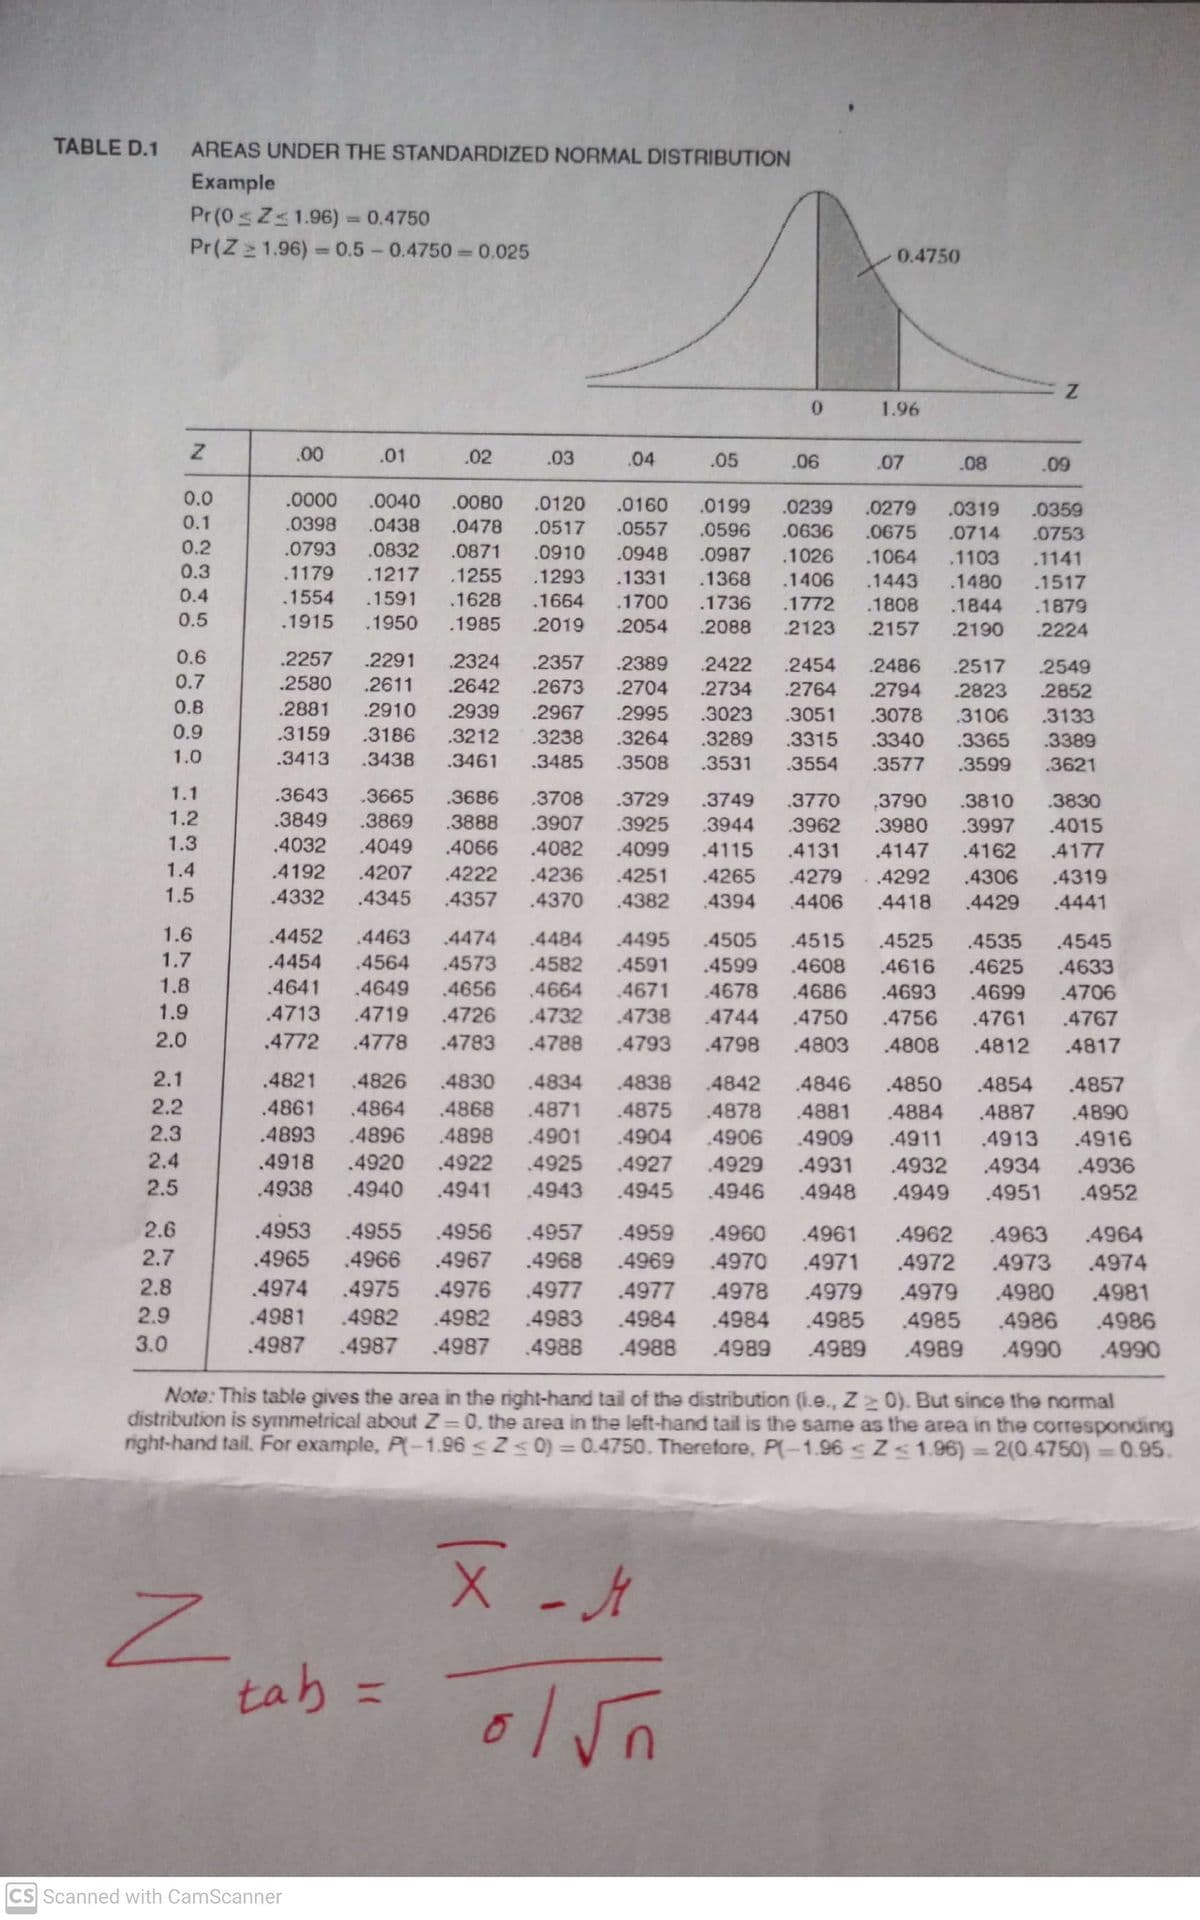
AREAS UNDER THE STANDARDIZED NORMAL DISTRIBUTION
Example
Pr (0 sZ<1.96) = 0.4750
%3D
Pr(Z 1.96) = 0.5 - 0.4750 0.025
0.4750
%3D
1.96
.00
.01
.02
.03
.04
.05
.06
.07
.08
.09
0.0
.0000
.0040
.0080
.0120
.0160
.0199
.0239
.0279
.0319
.0359
0.1
.0398
.0438
.0478
.0517
.0557
.0596
.0636
.0675
.0714
.0753
0.2
.0793
.0832
.0871
.0910
.0948
.0987 .1026
.1064
.1103
.1141
0.3
.1179
.1217
.1255
.1293
.1331
.1368
.1406
.1443
.1480
.1517
0.4
.1554
.1591
.1628
.1664
.1700
.1736
.1772
.1808
.1844
.1879
0.5
.1915
.1950
.1985
.2019
.2054
.2088
.2123
2157
.2190
2224
0.6
.2257
.2291
.2324
.2357
.2389
.2422
.2454
.2486
.2517
2549
0.7
.2580
.2611
.2642
.2673
.2704
.2734
.2764
.2794
2823
2852
0.8
.2881
.2910
.2939
.2967
.2995
.3023
.3051
.3078
.3106
.3133
0.9
.3159
.3186
.3212
.3238
.3264
.3289
3315
.3340 .3365
.3389
1.0
.3413
.3438
.3461
.3485
.3508
.3531
.3554
.3577
.3599
.3621
1.1
.3643
.3665
.3686
.3708
.3729
.3749
.3770
3790
.3810
.3830
1.2
.3849
.3869
.3888
.3907
.3925
.3944
.3962
.3980 .3997
4015
1.3
.4032
.4049
.4066
.4082
.4099
.4115
.4131
.4147 .4162
.4177
1.4
.4192
.4207
.4222
.4236
.4251
.4265
.4279. 4292
.4306
.4319
1.5
.4332
.4345
.4357
.4370
.4382
4394
4406
.4418 .4429
.4441
1.6
.4452
.4463
.4474
.4484
.4495
.4505
4515 .4525 .4535
.4545
1.7
.4454
.4564
.4573
.4582
.4591
.4599
.4608
.4616
.4625
.4633
1.8
.4641
4649
.4656
.4664
4671
4678
4686
.4693
.4699
.4706
1.9
.4713
.4719
.4726
.4732
.4738
.4744
.4750
.4756
.4761
.4767
2.0
.4772
.4778
.4783
.4788
.4793
.4798
.4803
.4808
.4812
.4817
2.1
.4821
.4826
.4830
.4834
4838
.4842
.4846
.4850
.4854
.4857
2.2
.4861 .4864
.4868
.4871
.4875
.4878
4881
4884
.4887
.4890
2.3
.4893
.4896
.4898
.4901
.4904
.4906
4909
.4911
.4913
.4916
2.4
.4918
.4920
.4922
.4925
.4927
.4929
.4931
.4932
.4934
4936
2.5
.4938
4940
.4941 .4943
.4945
.4946
.4948
.4949
.4951
.4952
2.6
.4953 .4955 .4956
.4957
.4959
.4960
4961 .4962
.4963
4964
2.7
.4965 .4966 4967
.4968
.4969
.4970
.4971
4972
4973
4974
2.8
.4974 .4975 .4976
.4977
.4977
.4978
4979
4979
4980
4981
2.9
.4981
.4982
.4982
.4983
.4984
.4984
.4986
4990
.4985
4985
.4986
3.0
.4987
.4987
.4987
.4988
.4988
4989
4989
4989
4990
Note: This table gives the area in the right-hand tail of the distribution (i.e., Z 0). But since the narmal
distribution is symmetrical about Z 0, the area in the left-hand tail is the same as the area in the corresponding
right-hand tail. For example, P-1.96 <Zs 0) = 0.4750. Therefore, P(-1.96 < Z<1.96) = 2(0.4750)=0.95.
%3D
%3D
tab =
%3D
CS Scanned with CamScanner
Transcribed Image Text:Question Five
The management of a supermarket wants to adopt a new promotional policy of
giving free gift to every customer who spends more than a certain amount per visit
at this supermarket. The expectation of the management is that after this
promotional policy is advertised, the expenditure for all customers at this
supermarket will be normally distributed with mean 400 £ and a variance of 900
£?.
1) If the management wants to give free gifts to at most 10% of the customers,
what should the amount be above which a customer would receive a free
gift?
2) In a sample of 100 customers, what are the number of customers whose
expenditure is between 420 £ and 485 £?
3) What is a probability of selecting a customer whose expenditure is differ than
the population mean expenditure by at most 50 £?
4) In a sample of 49 customers, what are the number of customers whose
mean expenditure is at least 410 £?
5) What is the probability that the expenditure of the first customer exceeds the
expenditure of the second customer by at least 20 £?
Expert Solution
This question has been solved!
Explore an expertly crafted, step-by-step solution for a thorough understanding of key concepts.

This is a popular solution!

Trending now
This is a popular solution!

Step by step
Solved in 3 steps

Knowledge Booster


Learn more about
Need a deep-dive on the concept behind this application? Look no further. Learn more about this topic, statistics and related others by exploring similar questions and additional content below.Recommended textbooks for you
MATLAB: An Introduction with Applications
Statistics
ISBN:
9781119256830
Author:
Amos Gilat
Publisher:
John Wiley & Sons Inc

Probability and Statistics for Engineering and th…
Statistics
ISBN:
9781305251809
Author:
Jay L. Devore
Publisher:
Cengage Learning

Statistics for The Behavioral Sciences (MindTap C…
Statistics
ISBN:
9781305504912
Author:
Frederick J Gravetter, Larry B. Wallnau
Publisher:
Cengage Learning
MATLAB: An Introduction with Applications
Statistics
ISBN:
9781119256830
Author:
Amos Gilat
Publisher:
John Wiley & Sons Inc
Probability and Statistics for Engineering and th…
Statistics
ISBN:
9781305251809
Author:
Jay L. Devore
Publisher:
Cengage Learning
Statistics for The Behavioral Sciences (MindTap C…
Statistics
ISBN:
9781305504912
Author:
Frederick J Gravetter, Larry B. Wallnau
Publisher:
Cengage Learning

Elementary Statistics: Picturing the World (7th E…
Statistics
ISBN:
9780134683416
Author:
Ron Larson, Betsy Farber
Publisher:
PEARSON

The Basic Practice of Statistics
Statistics
ISBN:
9781319042578
Author:
David S. Moore, William I. Notz, Michael A. Fligner
Publisher:
W. H. Freeman

Introduction to the Practice of Statistics
Statistics
ISBN:
9781319013387
Author:
David S. Moore, George P. McCabe, Bruce A. Craig
Publisher:
W. H. Freeman