QUestion Help v The data given to the right includes data from 45 candies, and 9 of them are red. The company that makes the candy claims that 29% of its candies are red. Use the sample data to construct a 95% confidence interval estimate of the percentage of red candies. What do you conclude about the claim of 29%? Weights (g) of a Sample Bag of Candy Red Blue 0.968 0.814 0.987 0.915 0.855 0.918 0.702 Brown Green Yellow 0.767 0.753 0.815 0.835 0.805 0.954 0.916 0.801 0.768 0.766 0.898 0.708 0.927 0.781 0.896 0.934 0.892 0.801 Construct a 95% confidence interval estimate of the population percentage of candies that are red. 0.786 0.881 0.817 %
QUestion Help v The data given to the right includes data from 45 candies, and 9 of them are red. The company that makes the candy claims that 29% of its candies are red. Use the sample data to construct a 95% confidence interval estimate of the percentage of red candies. What do you conclude about the claim of 29%? Weights (g) of a Sample Bag of Candy Red Blue 0.968 0.814 0.987 0.915 0.855 0.918 0.702 Brown Green Yellow 0.767 0.753 0.815 0.835 0.805 0.954 0.916 0.801 0.768 0.766 0.898 0.708 0.927 0.781 0.896 0.934 0.892 0.801 Construct a 95% confidence interval estimate of the population percentage of candies that are red. 0.786 0.881 0.817 %

College Algebra (MindTap Course List)
12th Edition
ISBN:9781305652231
Author:R. David Gustafson, Jeff Hughes
Publisher:R. David Gustafson, Jeff Hughes
Chapter8: Sequences, Series, And Probability
Section8.7: Probability
Problem 58E: What is meant by the sample space of an experiment?

Related questions
Topic Video
Question
Transcribed Image Text:Question Help
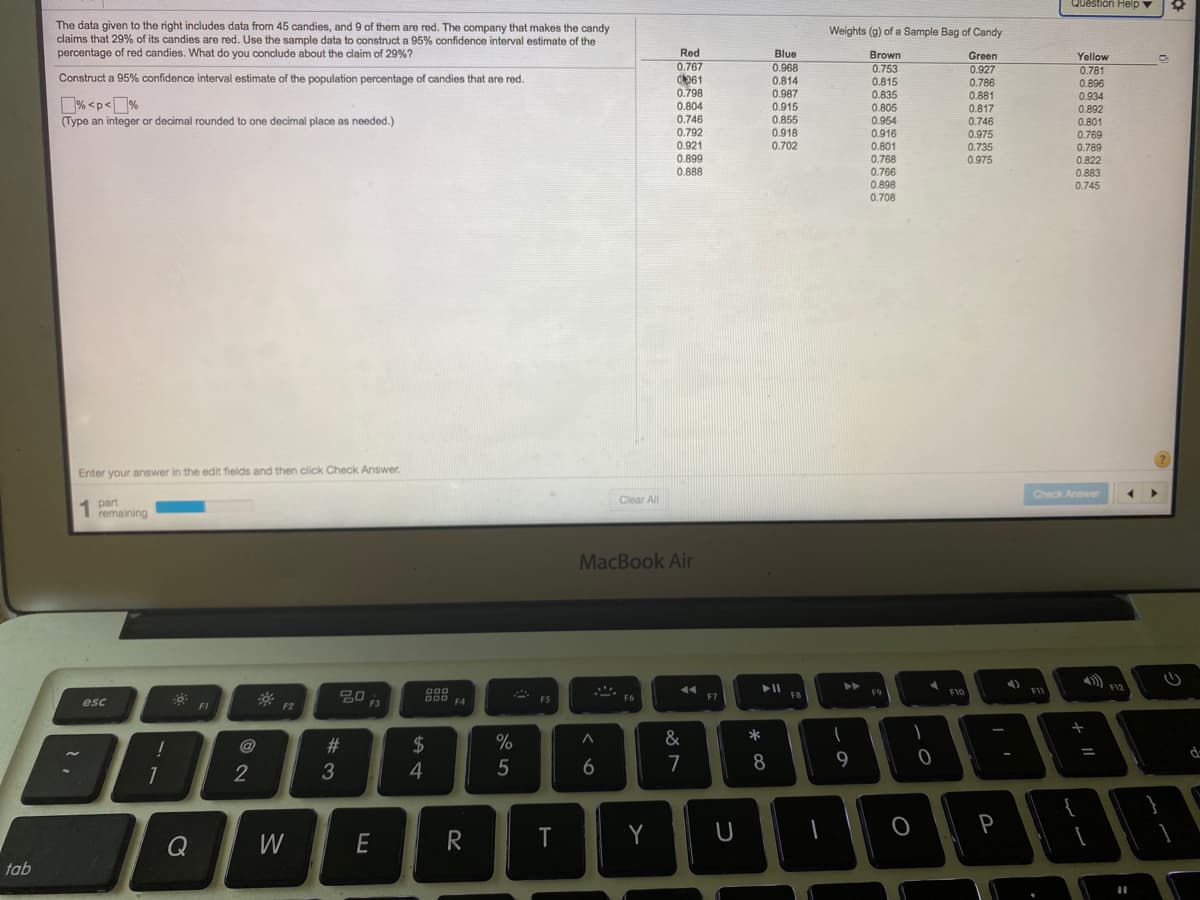
The data given to the right includes data from 45 candies, and 9 of them are red. The company that makes the candy
claims that 29% of its candies are red. Use the sample data to construct a 95% confidence interval estimate of the
percentage of red candies. What do you conclude about the claim of 29%?
Weights (g) of a Sample Bag of Candy
Red
Blue
Brown
Green
Yellow
0.767
0.968
0.814
0.987
0.915
0.753
0.815
0.835
0.805
0.927
0.786
0.881
0.817
0.781
0.896
Construct a 95% confidence interval estimate of the population percentage of candies that are red.
0.798
0.934
% <p<%
0.804
0.746
0.792
0.921
0.899
0.888
0,892
0.855
0.918
0.702
0.954
0.916
0.801
(Type an integer or decimal rounded to one decimal place as needed.)
0.746
0.975
0.801
0.769
0.789
0.735
0.768
0.766
0.898
0.708
0.975
0.822
0.883
0.745
Enter your answer in the edit fields and then click Check Answer.
Check Answer
Clear All
part
1 remaining
MacBook Air
F12
FS
F10
FI
F7
FB
esc
F3
F4
FI
F2
@
$
%
&
*
4
6
7
8
9
P
Q
W
tab
%# 3
Expert Solution
This question has been solved!
Explore an expertly crafted, step-by-step solution for a thorough understanding of key concepts.

This is a popular solution!

Trending now
This is a popular solution!

Step by step
Solved in 3 steps with 1 images

Knowledge Booster


Learn more about
Need a deep-dive on the concept behind this application? Look no further. Learn more about this topic, statistics and related others by exploring similar questions and additional content below.Recommended textbooks for you
College Algebra (MindTap Course List)
Algebra
ISBN:
9781305652231
Author:
R. David Gustafson, Jeff Hughes
Publisher:
Cengage Learning
College Algebra (MindTap Course List)
Algebra
ISBN:
9781305652231
Author:
R. David Gustafson, Jeff Hughes
Publisher:
Cengage Learning