Life Exp HS State Name Murder Grad Income Illiteracy Alabama 15.1 41.3 3624 2.1 69.05 Alaska 11.3 66.7 6315 1.5 69.31 Arizona 7.8 58.1 4530 1.8 70.55 Arkansas 10.1 39.9 3378 1.9 70.66 California 10.3 62.6 5114 1.1 71.71 Colorado 6.8 63.9 4884 0.7 72.06 Connecticut 3.1 56 5348 1.1 72.48 Delaware 6.2 54.6 4809 0.9 70.06 Florida 10.7 52.6 4815 1.3 70.66 Georgia 13.9 40.6 4091 2 68.54 Hawaii 6.2 61.9 4963 1.9 73.6 Idaho 5.3 59.5 4119 0.6 71.87 Illinois 10.3 52.6 5107 0.9 70.14 Indiana 7.1 52.9 4458 0.7 70.88 lowa 2.3 59 4628 0.5 72.56 Kansas 4.5 59.9 4669 0.6 72.58 Kentucky 10.6 38.5 3712 1.6 70.1 Louisiana 13.2 42.2 3545 2.8 68.76 Maine 2.7 54.7 3694 0.7 70.39 Maryland 8.5 52.3 5299 0.9 70.22 Massachusetts 3.3 58.5 4755 1.1 71.83 Michigan 11.1 52.8 4751 0.9 70.63 Minnesota 2.3 57.6 4675 0.6 72.96 Mississippi 12.5 41 3098 2.4 68.09 Missouri 9.3 48.8 4254 0.8 70.69 Montana 5 59.2 4347 0.6 70.56 Nebraska 2.9 59.3 4508 0.6 72.6 Nevada 11.5 65.2 5149 0.5 69.03 New Hampshire 3.3 57.6 4281 0.7 71.23 New Jersey 5.2 52.5 5237 1.1 70.93 New Mexico 9.7 55.2 3601 2.2 70.32 New York 10.9 52.7 4903 1.4 70.55 North Carolina 11.1 38.5 3875 1.8 69.21 North Dakota 1.4 50.3 5087 0.8 72.78

MATLAB: An Introduction with Applications
6th Edition
ISBN:9781119256830
Author:Amos Gilat
Publisher:Amos Gilat
Chapter1: Starting With Matlab
Section: Chapter Questions
Problem 1P
icon
Related questions
icon
Concept explainers
Question
Fifty states Here is a data set on various measures of the
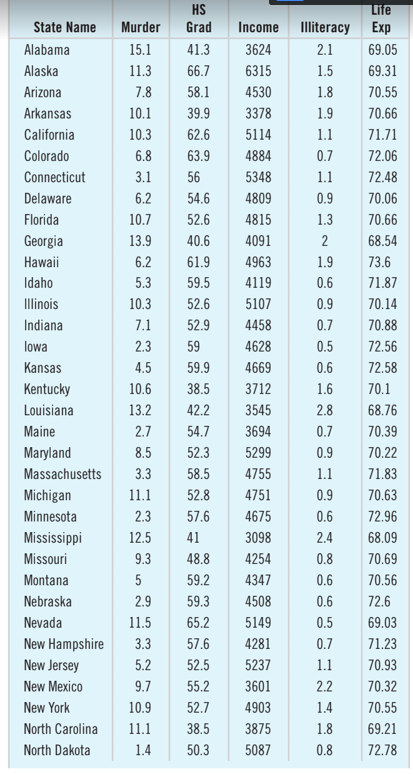
50 United States. The Murder rate is per 100,000, HS
Graduation rate is in %, Income is per capita income in
dollars, Illiteracy rate is per 1000, and Life Expectancy is
in years. Find a regression model for Life Expectancy
with three predictor variables by trying all four of the
possible models.
a) Which model appears to do the best?
b) Would you leave all three predictors in this model?
c) Does this model mean that by changing the levels of
the predictors in this equation, we could affect life
expectancy in that state? Explain.
d) Be sure to check the conditions for multiple regres-
sion. What do you conclude?
Life
Exp
HS
State Name
Murder
Grad
Income
Illiteracy
Alabama
15.1
41.3
3624
2.1
69.05
Alaska
11.3
66.7
6315
1.5
69.31
Arizona
7.8
58.1
4530
1.8
70.55
Arkansas
10.1
39.9
3378
1.9
70.66
California
10.3
62.6
5114
1.1
71.71
Colorado
6.8
63.9
4884
0.7
72.06
Connecticut
3.1
56
5348
1.1
72.48
Delaware
6.2
54.6
4809
0.9
70.06
Florida
10.7
52.6
4815
1.3
70.66
Georgia
13.9
40.6
4091
2
68.54
Hawaii
6.2
61.9
4963
1.9
73.6
Idaho
5.3
59.5
4119
0.6
71.87
Illinois
10.3
52.6
5107
0.9
70.14
Indiana
7.1
52.9
4458
0.7
70.88
lowa
2.3
59
4628
0.5
72.56
Kansas
4.5
59.9
4669
0.6
72.58
Kentucky
10.6
38.5
3712
1.6
70.1
Louisiana
13.2
42.2
3545
2.8
68.76
Maine
2.7
54.7
3694
0.7
70.39
Maryland
8.5
52.3
5299
0.9
70.22
Massachusetts
3.3
58.5
4755
1.1
71.83
Michigan
11.1
52.8
4751
0.9
70.63
Minnesota
2.3
57.6
4675
0.6
72.96
Mississippi
12.5
41
3098
2.4
68.09
Missouri
9.3
48.8
4254
0.8
70.69
Montana
5
59.2
4347
0.6
70.56
Nebraska
2.9
59.3
4508
0.6
72.6
Nevada
11.5
65.2
5149
0.5
69.03
New Hampshire
3.3
57.6
4281
0.7
71.23
New Jersey
5.2
52.5
5237
1.1
70.93
New Mexico
9.7
55.2
3601
2.2
70.32
New York
10.9
52.7
4903
1.4
70.55
North Carolina
11.1
38.5
3875
1.8
69.21
North Dakota
1.4
50.3
5087
0.8
72.78
Transcribed Image Text:Life Exp HS State Name Murder Grad Income Illiteracy Alabama 15.1 41.3 3624 2.1 69.05 Alaska 11.3 66.7 6315 1.5 69.31 Arizona 7.8 58.1 4530 1.8 70.55 Arkansas 10.1 39.9 3378 1.9 70.66 California 10.3 62.6 5114 1.1 71.71 Colorado 6.8 63.9 4884 0.7 72.06 Connecticut 3.1 56 5348 1.1 72.48 Delaware 6.2 54.6 4809 0.9 70.06 Florida 10.7 52.6 4815 1.3 70.66 Georgia 13.9 40.6 4091 2 68.54 Hawaii 6.2 61.9 4963 1.9 73.6 Idaho 5.3 59.5 4119 0.6 71.87 Illinois 10.3 52.6 5107 0.9 70.14 Indiana 7.1 52.9 4458 0.7 70.88 lowa 2.3 59 4628 0.5 72.56 Kansas 4.5 59.9 4669 0.6 72.58 Kentucky 10.6 38.5 3712 1.6 70.1 Louisiana 13.2 42.2 3545 2.8 68.76 Maine 2.7 54.7 3694 0.7 70.39 Maryland 8.5 52.3 5299 0.9 70.22 Massachusetts 3.3 58.5 4755 1.1 71.83 Michigan 11.1 52.8 4751 0.9 70.63 Minnesota 2.3 57.6 4675 0.6 72.96 Mississippi 12.5 41 3098 2.4 68.09 Missouri 9.3 48.8 4254 0.8 70.69 Montana 5 59.2 4347 0.6 70.56 Nebraska 2.9 59.3 4508 0.6 72.6 Nevada 11.5 65.2 5149 0.5 69.03 New Hampshire 3.3 57.6 4281 0.7 71.23 New Jersey 5.2 52.5 5237 1.1 70.93 New Mexico 9.7 55.2 3601 2.2 70.32 New York 10.9 52.7 4903 1.4 70.55 North Carolina 11.1 38.5 3875 1.8 69.21 North Dakota 1.4 50.3 5087 0.8 72.78
Expert Solution
trending now

Trending now

This is a popular solution!

steps

Step by step

Solved in 5 steps with 12 images

Blurred answer
Knowledge Booster
Correlation, Regression, and Association
Learn more about
Need a deep-dive on the concept behind this application? Look no further. Learn more about this topic, statistics and related others by exploring similar questions and additional content below.
Similar questions
  • SEE MORE QUESTIONS
Recommended textbooks for you
MATLAB: An Introduction with Applications
Statistics
ISBN:
9781119256830
Author:
Amos Gilat
Publisher:
John Wiley & Sons Inc
Probability and Statistics for Engineering and th…
Statistics
ISBN:
9781305251809
Author:
Jay L. Devore
Publisher:
Cengage Learning
Statistics for The Behavioral Sciences (MindTap C…
Statistics
ISBN:
9781305504912
Author:
Frederick J Gravetter, Larry B. Wallnau
Publisher:
Cengage Learning
Elementary Statistics: Picturing the World (7th E…
Statistics
ISBN:
9780134683416
Author:
Ron Larson, Betsy Farber
Publisher:
PEARSON
The Basic Practice of Statistics
Statistics
ISBN:
9781319042578
Author:
David S. Moore, William I. Notz, Michael A. Fligner
Publisher:
W. H. Freeman
Introduction to the Practice of Statistics
Statistics
ISBN:
9781319013387
Author:
David S. Moore, George P. McCabe, Bruce A. Craig
Publisher:
W. H. Freeman