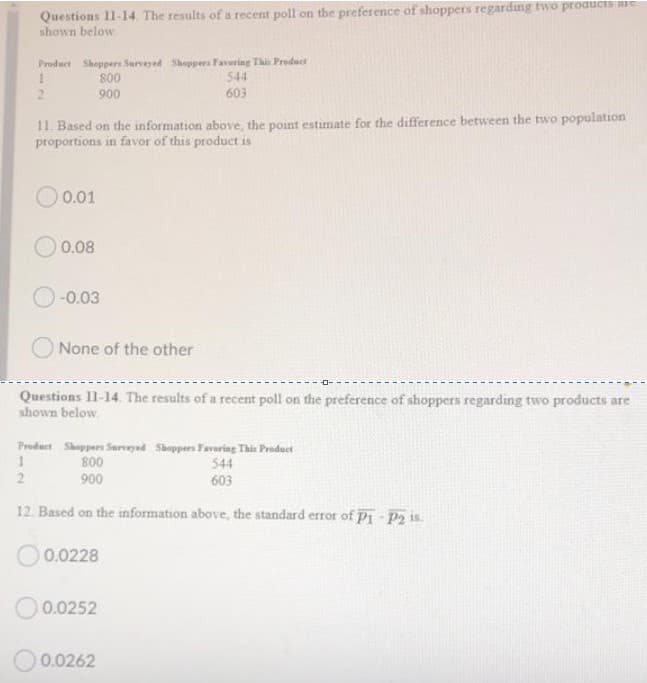
Questions 1-14. The results of a recent poll ol th shown below Product Shoppers Serveyed Shoppers Favring Th Preduct 544 603 s00 2. 900 11. Based on the information above, the point estimate for the difference between the twe proportions in favor of this product is


Q: Problem 1: A sample of 100 bulbs of brand A gave a mean lifetime of 1200 has with a S.D. of 70hrs,…
A: Given: The descriptive statistics is as follows Sample size Sample mean Sample standard…
Q: Question 4 Consider a population with mean u and variance o2 < 0. We collect an IID sample x1,...,…
A: Solution
Q: Illustration 11.28. In a continuous frequency distribution grouped in intervals of 2, the first four…
A:
Q: Question 30. Given a sample of n=5 data values: X1=12, x2 23, x3=26, x4=28, and xs = 10 %3D %3D Up…
A: We have given a sample of n=5 data values i.e., x1=12, x2=23, x3=26, x4=28, and x5=10
Q: Joan was convinced that students who study abroad during college would report a more positive…
A: Hypothesis: Null hypothesis: H0: μ=4.5Alternative hypothesis: H1: μ>4.5 Step-by-step procedure to…
Q: ted
A: A hypothesis test known as a t test for one mean seeks to infer anything about the population mean.…
Q: Listed below are body temperatures from five different subjects measured at 8 AM and again at 12 AM.…
A: The body temperatures from five different subjects measured at 8 AM and again at 12 AM, are given.
Q: Joan was convinced that students who study abroad during college would report a more positive…
A: X (x-xbar)^2 4 4 6 0 7 1 7 1 6 0 5 1 7 1 The mean is given by The standard…
Q: For 50 randomly selected speed dates, attractiveness ratings by males of their female date…
A: The given regression line equation is ŷ = 8.19−0.338x.
Q: QUESTION 8 According to WorldAtlas, approximately 79% of the world population has brown eyes The…
A: Let x be the no of brown eyes x=22 Total no of samples n=40 Then to find sample proportion p of…
Q: QUESTION 22 Which of the following is an example of true random sampling O Selecting only blonde…
A:
Q: Question 2: For the purpose of illustrating the procedures, assume we know that 70% of a population…
A: Sample 1:There are 21 individuals in the first sample who believe in climate change The sample…
Q: I need help finding the test statistic, p-value, & if it's reject/ fail to reject. Thank you.
A: From the given information, it can be observed the test is two tailed.
Q: 10, where 1 = very liberal and 10 = very conservative) and U.S. geographic regions, such that people…
A: Here we are given a hypothesis where we have to test the relation between the geographical location…
Q: Question 9 The mean annual tuition and fees for a sample of 15 private colleges was $35,500 with a…
A:
Q: Question 5 For each of the following tobs values, determine the highest level of significance…
A: The objective is to determine the highest level of significance associated with the decision taken.
Q: Part 1 of 2 Identify the five-number summary. Round your answers to one decimal place as needed. De,…
A: Since you have asked multiple question, we will solve the first question for you. If you want any…
Q: QUESTION 2 The molecular weight of a particular polymer should fall between 167 and 479. Fourty…
A: We have given that Mean = 271 Standard deviation = 65 The molecular weight is normally distributed.
Q: Question 28. Can there be a set of data fitting to both the following histograms? Which of these…
A: From both the histogram to the left, it can be observed that, the dataset consists of both negative…
Q: utrition The mean ±1 sd of In [calcium intake (mg)] among 25 females, 12 to 14 years of age, below…
A: Note: Hey, since there are multiple questions posted, we will answer first question. If you want any…
Q: In an exercise program there are a total90 women enrolled. The women are in the two age groups (i)…
A: The two age groups of women are to be compared for weight loss. These two groups are independent of…
Q: produced
A: 1) In this case the population size is large so it will be some difficult and take long time to…
Q: a) the following data are taken from the steam table. 140 Temp. °C, t 150 160 170 180 Ptessure, p…
A: Use the standard equation of regression line. Determine the value of the variables using their…
Q: QUESTION 11 Q11. What is the crude (unadjusted) mortality rate (per 100,000) for the 19-29 years age…
A: Note: Since there are more than 3 subparts, as per guidelines we will answer first three subparts.…
Q: Joan was convinced that students who study abroad during college would report a more positive…
A: Solution : Given : m = 4.5 = average experience n = 7 Population : Population is…
Q: 2. Determine the approximate value of y if x = 1.5 for the data set {(-1, 5), (0, 1), (1, 1), (2,…
A:
Q: For item 1 to 3. Table 1.3 The following figures, released by the Federal Trade Commission, show the…
A: Given data is mg. of tar and nicotine content in 10 brands n=No. of observation=10 Let X: Tar…
Q: QUESTION # 2 (a) A laboratory that was contracted to analyze 100 soil samples for chlordane per…
A: Given, following data are given for chlordane concentration. Method concentrations 1…
Q: Joan was convinced that students who study abroad during college would report a more positive…
A: Use the given data to form excel table: x x-μ x-μ2 4 -2 4 6 0 0…
Q: Step 2: Determine the characteristics of the comparison distribution. In other words, what is the…
A: given : data : 4,6,7,7,6,5,7 average college experience = μ = 4.5 to find: sample mean, Degree…
Q: The following is a list of 4 measurements. 9, 15, 11, 17 Send data to calculator Send data to Excel…
A: Find sum of squares of observations 9,15,11,17
Q: Prepare a table like the one given by using the same procedure (a) for the case in which you draw…
A: a) Given data: The given number of marbles is: 3. The below table shows the possible outcome…
Q: You split a test into two halves which have equal test lengths. The two half-tests are essentially…
A: Given: Split-half method of estimating reliability is used where test lengths are equal.
Q: QUESTION 22 Which of the following is an example of true random sampling O Selecting only blonde…
A: Solution. In a true random sampling the samples are drawn randomly.
Q: 10.6 Do people find hairy spiders scarier than non- hairy spiders? To find out, 20 people were ran-…
A: Given, Hairy Non-Hairy 10 7 8 6 7 8 9 6 9 1 10 5 9 4 9 5 5 6 8 3
Q: QUESTION 3 Fill in the table below: df MS F Source of Variation SS Between 40 groups Within 30…
A: Given : ANOVA Table
Q: Question 13: A group of 5 people joined a meditation class designed to increase their energy level,…
A: The given data of 5 people are: Before 67 60 55 45 65 After 83 75 68 56 81
Q: For items 25 to 26: A farmer has decided to use a new additive to grow his crops. He divided his…
A: The data on the record of the corn yield (in bushels) relating to the before and after usage of the…
Q: The accompanying observations (shown in Table 2) are about residual flame time (sec) for strips of…
A:
Q: A sample of size 40 yields the following sorted data. Note that I have x-ed out a(39) (the sec- ond…
A: (b) The one sd interval ranges from 63.5-12.33=51.17 to 63.5+12.33=75.83 This interval contains…
Q: Question 9 A sample of 5 000 Johannesburg households is selected and sev statement that is correct.…
A: Continuous Quantitative data: The data which can be measured is known as continuous quantitative…
Q: A.)For this study, we should use Select an answer t-test for a population mean z-test for a…
A: Answer: A) For this study, we should do t-test for population mean.
Q: For items 25 to 26: A farmer has decided to use a new additive to grow his crops. He divided his…
A: Given data, Plot Before After 1 9 10 2 9 9 3 8 9 4 7 8 5 6 7 6 8 10 7 5 6 8 9 10…
Q: Question 13 Two possible p-values are given. Which one provides the strongest evidence against H0?…
A: Give, p- value = 0.03 p- value = 0.0007
Q: Question 4: A sample of 6 children was selected, da kilograms was recorded as shown in the following…
A: to find the correlation and the scatter plot
Q: Using the data in Experiment 2, investigate how the RHA addition and the admixture addition affect…
A: "Since you have posted a question with multiple sub-parts, we will solve the first three sub-parts…
Q: Question 6. For a sample of 10 observations of two independent variables X and Y, we give =5 an y =…
A: Given: x¯=5y¯=10n=10
Q: Q.4: Solve the following problem: 20 samples of manufactured pipe were inspected to measure the…
A: The objective is to construct frequency table and find mean , variance,SD.
Q: Question 16. Given a sample of n=5 data values: X1 = 12, x2 23, X3 26, x4 = 28, and x5 =10 %3D Find…
A: according to our guidelines we can answer only three subparts, or first question and rest can be…
Q: An insurance company selected samples of clients under 18 years of age and over 18 and recorded the…
A:
Pls help, answer both question in simple 5-6 sentence

Step by step
Solved in 2 steps with 2 images

- Question 4 a The researcher is concerned that older persons may not be knowledgeable of the COFLU-20. Assuch, he is interested in investigating the association between the age of the respondents and theirknowledge level. Table 2 below shows the knowledge level of respondents, by age group.Table 2Age Group Knowledge Level TotalPoor Satisfactory Good18 - 25 33 16 13 6226 - 34 30 18 12 6035 - 44 29 14 12 5545 - 54 36 16 18 7055 - 75 17 14 22 53Total 145 78 77 300 Conduct a test, at the 5% level of significance, to determine whether the data provided sufficientevidence to conclude that an association exists between age group and knowledge level. (i) State the hypotheses to be tested:H0:H1: Calculate:(ii) state the degrees of freedom for this test (iii) the p-value for this test, given that the chi-square test statistic, x2, is 11.029. (iv) state the conclusion for the test. Give reason for your answer.QUESTION 4(a) The researcher is concerned that older persons may not be knowledgeable of the COFLU-20. Assuch, he is interested in investigating the association between the age of the respondents and theirknowledge level. Table 2 below shows the knowledge level of respondents, by age group.Table 2Age Group Knowledge Level TotalPoor Satisfactory Good18 - 25 33 16 13 6226 - 34 30 18 12 6035 - 44 29 14 12 5545 - 54 36 16 18 7055 - 75 17 14 22 53Total 145 78 77 300Conduct a test, at the 5% level of significance, to determine whether the data provided sufficientevidence to conclude that an association exists between age group and knowledge level.(i) State the hypotheses to be tested:H0:H1: [Calculate:(ii) state the degrees of freedom for this test (iii) the p-value for this test, given that the chi-square test statistic, 2, is 11.029.(iv) state the conclusion for the test. Give reason for your answer.continueQUESTION 4(a) The researcher is concerned that older persons may not be knowledgeable of the COFLU-20. Assuch, he is interested in investigating the association between the age of the respondents and theirknowledge level. Table 2 below shows the knowledge level of respondents, by age group.Table 2Age Group Knowledge Level TotalPoor Satisfactory Good18 - 25 33 16 13 6226 - 34 30 18 12 6035 - 44 29 14 12 5545 - 54 36 16 18 7055 - 75 17 14 22 53Total 145 78 77 300Conduct a test, at the 5% level of significance, to determine whether the data provided sufficientevidence to conclude that an association exists between age group and knowledge level.(i) State the hypotheses to be tested:H0:H1: Calculate:(ii) state the degrees of freedom for this test (iii) the p-value for this test, given that the chi-square test statistic, 2, is 11.029.(iv) state the conclusion for the test. Give reason for your answer.
- Item 9 At a research facility that designs rocket engines, researchers know that some engines fail to ignite as a result of fuel system error. From a random sample of 40 engines of one design, 14 failed to ignite as a result of fuel system error. From a random sample of 30 engines of a second design, 9 failed to ignite as a result of fuel system error. The researchers want to estimate the difference in the proportion of engine failures for the two designs. Which of the following is the most appropriate method to create the estimate? A one-sample z-interval for a sample proportion A A one-sample z-interval for a population proportion B A two-sample z-interval for a population proportion C A two-sample z-interval for a difference in sample proportions D A two-sample z-interval for a difference in population proportionsquestion 8 a recent survey releved that 54% of 18 to 34 year old , 33% of 35 to 54 year old and 15% those ages 55+ use youtube to listen to music . if 10 people ages 55+ are randomly selected find the probablitity that at most 1 use youtube to listen to music?Question 5For each of the following tobs values, determine the highest level of significance associated with the decision taken. *NB:* Please show working tobs df Decision (iv) -1.586 60 Reject Ha for a one-tailed test
- Question 5For each of the following tobs values, determine the highest level of significance associated with the decision taken. tobs df Decision (i) 4.000 17 Reject Ha for a two-tailed test (ii) 1.200 120 Reject Ha for a one-tailed test (iii) -2.660 16 Reject Ha for both one-tailed and two-tailed test (iv) -1.586 60 Reject Ha for a one-tailed testQuestion(13): The researcher decided to conduct the study again and selected an additional 10 children from the full time kindergarden and an additional 10 children from partime kindergarden.This time they matched the children in full time and part time based on SES, gender, age and vocabulary scores. They based their hypotheses on the finding from a previous study and wanted to see if children who attended full time kindergarden would have better short term memory recall comparred to children who attended partime kindergarden. Researcher read a list of 20 words then waited for two minutes, as the children had snacks, then ask then to tell them as many words as the could from the list of 20 words. Those who remember got a score of 1. Here is a summary of the result. full time kindergarden: 15 9 10 8 11 7 14 12 11 13 part time kindergarden: 10 7 9 8 12 6 8 10 7 9 Test the hypothses at (alpha…Questions 8-9, use the same information below. A marketing researcher wishes to determine if over 60% of the wine drinkers prefer a certain brand of wine or not. The marketing researcher selects a random sample of size 900 and finds that 558 of them prefer this brand of wine. Question 8. The p-value is closest to Group of answer choices 0.0132 0.001 0.05 0.1112 0.0921 Questions 8-9, use the same information below. A marketing researcher wishes to determine if over 60% of the wine drinkers prefer a certain brand of wine or not. The marketing researcher selects a random sample of size 900 and finds that 558 of them prefer this brand of wine. Question 9. At a 5% signficance level, the sample evidence Group of answer choices does not support the statement that over 60% of the wine drinkers prefer this brand of wine. cannot lead to a conclusion. supports the statement that over 60% of the wine drinkers prefer this brand of wine.
- QUESTION 1 Use the following description for Questions 1-3.A consumer products company uses direct mail marketing for its advertising campaigns. The company has three different designs (1, 2, and 3) for a new brochure designed for customers in four regions (NE = north east, NW = north west, SE = south east, and SW = south west). The company decides to test the design types by mailing samples of each design to potential customers in each region. They repeat the direct mailing campaign 3 times for each design type and region combination and record the number of responses they receive (denoted as Response). The company wonders if the design type and region have an impact on the number of responses they get. Question 1)What type of statistical model would you use to test if the design type and region have an impact on the number of survey responses? A.) Two sample z test B.) Two sample t test C.) One-way ANOVA D.) Two-way ANOVA 2. What…QUESTION 1 Use the following description for Questions 1-3.A consumer products company uses direct mail marketing for its advertising campaigns. The company has three different designs (1, 2, and 3) for a new brochure designed for customers in four regions (NE = north east, NW = north west, SE = south east, and SW = south west). The company decides to test the design types by mailing samples of each design to potential customers in each region. They repeat the direct mailing campaign 3 times for each design type and region combination and record the number of responses they receive (denoted as Response). The company wonders if the design type and region have an impact on the number of responses they get. Question 1)What type of statistical model would you use to test if the design type and region have an impact on the number of survey responses? A Two sample z test B Two sample t test C One-way ANOVA D Two-way ANOVA QUESTION 2…QUESTION 8 Rocky Mountain National Park is a popular park for outdoor recreation activities in Colorado. According to U.S. National Park Service statistics, 46.7% of visitors to Rocky Mountain National Park in 2018 entered through the Beaver Meadows park entrance, 24.3% of visitors entered through the Fall River park entrance, 6.3% of visitors entered through the Grand Lake park entrance, and 22.7% of visitors had no recorded point of entry to the park.† Consider a random sample of 175 Rocky Mountain National Park visitors. Use the normal approximation of the binomial distribution to answer the following questions. (Round your answers to four decimal places.) (a) What is the probability that at least 85 visitors had a recorded entry through the Beaver Meadows park entrance? (b) What is the probability that at least 80 but less than 90 visitors had a recorded entry through the Beaver Meadows park entrance? (c) What is the probability that fewer than 12 visitors had a…


