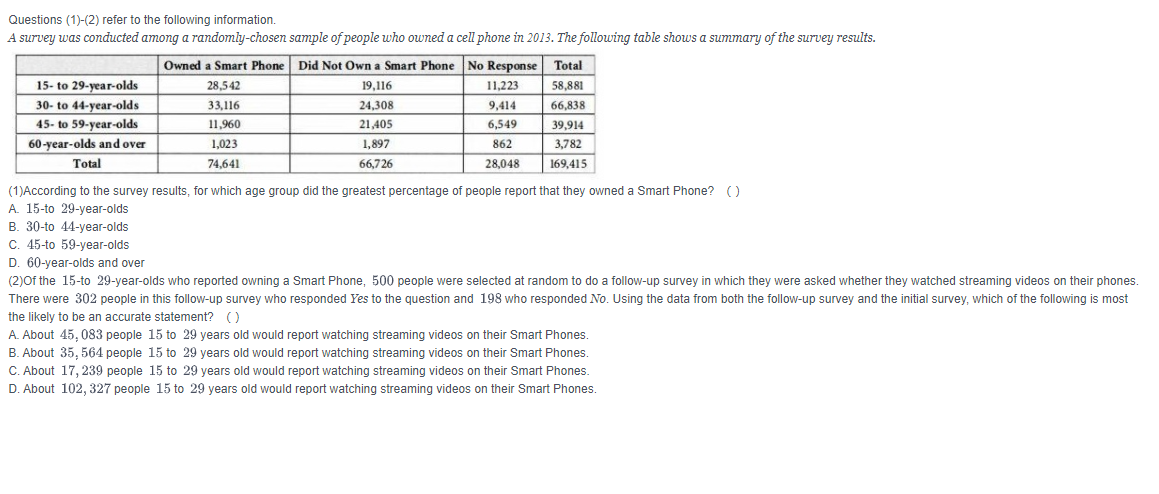
Questions (1)-(2) refer to the following information. A survey was conducted among a randomly-chosen sample of people who owned a cell phone in 2013. The following table shows a summary of the survey results. Owned a Smart Phone Did Not Own a Smart Phone No Response Total 15- to 29-year-olds 28,542 19,116 11,223 58,881 30- to 44-year-olds 33,116 24,308 9,414 66,838 45- to 59-year-olds 11,960 21,405 6,549 39,914 60-year-olds and over 1,023 1,897 862 3,782 Total 74,641 66,726 28,048 169,415 (1)According to the survey results, for which age group did the greatest percentage of people report that they owned a Smart Phone? () A. 15-to 29-year-olds B. 30-to 44-year-olds C. 45-to 59-year-olds D. 60-year-olds and over (2)Of the 15-to 29-year-olds who reported owning a Smart Phone, 500 people were selected at random to do a follow-up survey in which they were asked whether they watched streaming videos on their phones. There were 302 people in this follow-up survey who responded Yes to the question and 198 who responded No. Using the data from both the follow-up survey and the initial survey, which of the following is most the likely to be an accurate statement? () A. About 45, 083 people 15 to 29 years old would report watching streaming videos on their Smart Phones. B. About 35, 564 people 15 to 29 years old would report watching streaming videos on their Smart Phones. C. About 17, 239 people 15 to 29 years old would report watching streaming videos on their Smart Phones. D. About 102, 327 people 15 to 29 years old would report watching streaming videos on their Smart Phones.
Questions (1)-(2) refer to the following information. A survey was conducted among a randomly-chosen sample of people who owned a cell phone in 2013. The following table shows a summary of the survey results. Owned a Smart Phone Did Not Own a Smart Phone No Response Total 15- to 29-year-olds 28,542 19,116 11,223 58,881 30- to 44-year-olds 33,116 24,308 9,414 66,838 45- to 59-year-olds 11,960 21,405 6,549 39,914 60-year-olds and over 1,023 1,897 862 3,782 Total 74,641 66,726 28,048 169,415 (1)According to the survey results, for which age group did the greatest percentage of people report that they owned a Smart Phone? () A. 15-to 29-year-olds B. 30-to 44-year-olds C. 45-to 59-year-olds D. 60-year-olds and over (2)Of the 15-to 29-year-olds who reported owning a Smart Phone, 500 people were selected at random to do a follow-up survey in which they were asked whether they watched streaming videos on their phones. There were 302 people in this follow-up survey who responded Yes to the question and 198 who responded No. Using the data from both the follow-up survey and the initial survey, which of the following is most the likely to be an accurate statement? () A. About 45, 083 people 15 to 29 years old would report watching streaming videos on their Smart Phones. B. About 35, 564 people 15 to 29 years old would report watching streaming videos on their Smart Phones. C. About 17, 239 people 15 to 29 years old would report watching streaming videos on their Smart Phones. D. About 102, 327 people 15 to 29 years old would report watching streaming videos on their Smart Phones.

Glencoe Algebra 1, Student Edition, 9780079039897, 0079039898, 2018
18th Edition
ISBN:9780079039897
Author:Carter
Publisher:Carter
Chapter10: Statistics
Section10.6: Summarizing Categorical Data
Problem 10CYU

Related questions
Topic Video
Question
Transcribed Image Text:Questions (1)-(2) refer to the following information.
A survey was conducted among a randomly-chosen sample of people who owned a cell phone in 2013. The following table shows a summary of the survey results.
Owned a Smart Phone Did Not Own a Smart Phone No Response Total
15- to 29-year-olds
28,542
19,116
11,223
58,881
30- to 44-year-olds
33,116
24,308
9,414
66,838
45- to 59-year-olds
11,960
21,405
6,549
39,914
60-year-olds and over
1,023
1,897
862
3,782
Total
74,641
66,726
28,048
169,415
(1)According to the survey results, for which age group did the greatest percentage of people report that they owned a Smart Phone? ()
A. 15-to 29-year-olds
B. 30-to 44-year-olds
C. 45-to 59-year-olds
D. 60-year-olds and over
(2)Of the 15-to 29-year-olds who reported owning a Smart Phone, 500 people were selected at random to do a follow-up survey in which they were asked whether they watched streaming videos on their phones.
There were 302 people in this follow-up survey who responded Yes to the question and 198 who responded No. Using the data from both the follow-up survey and the initial survey, which of the following is most
the likely to be an accurate statement? ()
A. About 45, 083 people 15 to 29 years old would report watching streaming videos on their Smart Phones.
B. About 35, 564 people 15 to 29 years old would report watching streaming videos on their Smart Phones.
C. About 17, 239 people 15 to 29 years old would report watching streaming videos on their Smart Phones.
D. About 102, 327 people 15 to 29 years old would report watching streaming videos on their Smart Phones.
Expert Solution
This question has been solved!
Explore an expertly crafted, step-by-step solution for a thorough understanding of key concepts.

This is a popular solution!

Trending now
This is a popular solution!

Step by step
Solved in 3 steps

Knowledge Booster


Learn more about
Need a deep-dive on the concept behind this application? Look no further. Learn more about this topic, statistics and related others by exploring similar questions and additional content below.Recommended textbooks for you
Glencoe Algebra 1, Student Edition, 9780079039897…
Algebra
ISBN:
9780079039897
Author:
Carter
Publisher:
McGraw Hill

College Algebra (MindTap Course List)
Algebra
ISBN:
9781305652231
Author:
R. David Gustafson, Jeff Hughes
Publisher:
Cengage Learning
Glencoe Algebra 1, Student Edition, 9780079039897…
Algebra
ISBN:
9780079039897
Author:
Carter
Publisher:
McGraw Hill
College Algebra (MindTap Course List)
Algebra
ISBN:
9781305652231
Author:
R. David Gustafson, Jeff Hughes
Publisher:
Cengage Learning