r the following data on x = rainfall volume (m3) and y = runoff volume (m³) for a particular location. 7 12 14 17 23 30 40 49 55 67 72 83 96 112 127 y 4 10 13 15 15 25 27 46 38 46 53 70 82 99 103 accompanying Minitab output to decide whether there is a useful linear relationship between rainfall and runoff. The regression equation is runoff = -2.00 + 0.841 rainfall Predictor Coef Stdev t-ratio Constant -2.000 2.194 -0.91 0.379 rainfall 0.84079 0.03369 24.96 0.000 = = 4.823 R-sg = 98.08 R-sq (adj) = 97.8% e appropriate null and alternative hypotheses. B 0 B, = 0 B, > 0 B, = 0 e the test statistic value and find the P-value. (Round your test statistic to two decimal places and your P-value to three decimal places.) =24.96 =0.000 e conclusion in the problem context. (Use a = 0.05.) ct H. There is a useful linear relationship between runoff and rainfall at the 0.05 level. ct H. There is not a useful linear relationship between runoff and rainfall at the 0.05 level. co reject H.. There is not a useful linear relationship between runoff and rainfall at the 0.05 level. co reject H.. There is a useful linear relationship between runoff and rainfall at the 0.05 level. e a 95% confidence interval for the true average change in runoff volume associated with a 1 m3 increase in rainfall volume. (Round your answers to three decimal places.)
r the following data on x = rainfall volume (m3) and y = runoff volume (m³) for a particular location. 7 12 14 17 23 30 40 49 55 67 72 83 96 112 127 y 4 10 13 15 15 25 27 46 38 46 53 70 82 99 103 accompanying Minitab output to decide whether there is a useful linear relationship between rainfall and runoff. The regression equation is runoff = -2.00 + 0.841 rainfall Predictor Coef Stdev t-ratio Constant -2.000 2.194 -0.91 0.379 rainfall 0.84079 0.03369 24.96 0.000 = = 4.823 R-sg = 98.08 R-sq (adj) = 97.8% e appropriate null and alternative hypotheses. B 0 B, = 0 B, > 0 B, = 0 e the test statistic value and find the P-value. (Round your test statistic to two decimal places and your P-value to three decimal places.) =24.96 =0.000 e conclusion in the problem context. (Use a = 0.05.) ct H. There is a useful linear relationship between runoff and rainfall at the 0.05 level. ct H. There is not a useful linear relationship between runoff and rainfall at the 0.05 level. co reject H.. There is not a useful linear relationship between runoff and rainfall at the 0.05 level. co reject H.. There is a useful linear relationship between runoff and rainfall at the 0.05 level. e a 95% confidence interval for the true average change in runoff volume associated with a 1 m3 increase in rainfall volume. (Round your answers to three decimal places.)

College Algebra
7th Edition
ISBN:9781305115545
Author:James Stewart, Lothar Redlin, Saleem Watson
Publisher:James Stewart, Lothar Redlin, Saleem Watson
Chapter1: Equations And Graphs
Section: Chapter Questions
Problem 10T: Olympic Pole Vault The graph in Figure 7 indicates that in recent years the winning Olympic men’s...

Related questions
Question
the last question, The one that hasn't been answered
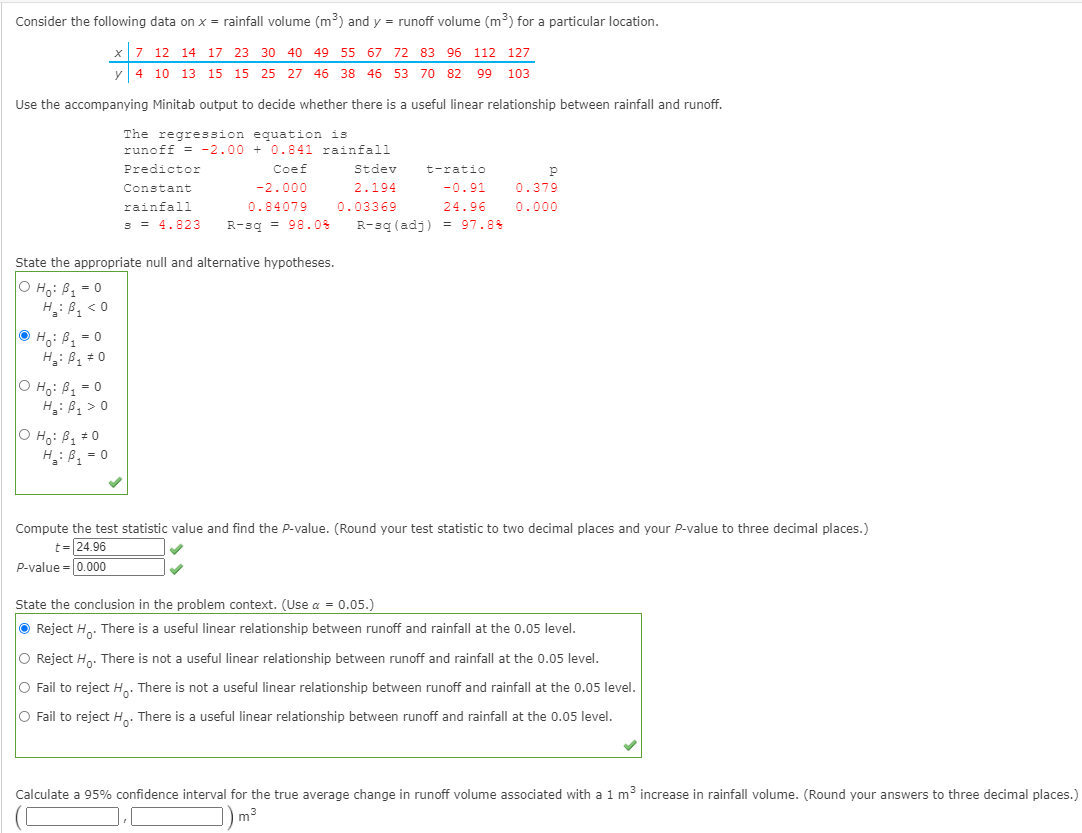
Transcribed Image Text:Consider the following data on x = rainfall volume (m3) and y = runoff volume (m³) for a particular location.
x 7 12 14 17 23 30 40 49 55 67 72 83 96 112 127
y 4 10 13 15
15 25 27 46 38 46 53 70 82
99 103
Use the accompanying Minitab output to decide whether there is a useful linear relationship between rainfall and runoff.
The regression equation is
runoff = -2.00 + 0.841 rainfall
Predictor
Coef
Stdev
t-ratio
Constant
-2.000
2.194
-0.91
0.379
rainfall
0.84079
0.03369
24.96
0.000
s = 4.823
R-sg = 98.0%
R-sg (adj) = 97.8%
State the appropriate null and alternative hypotheses.
O H,: B, = 0
H: B, < 0
O Ho: B1 = 0
H: B, # 0
O Ho: B, = 0
H,: B, > 0
O Ho: B1 = 0
H: B, = 0
Compute the test statistic value and find the P-value. (Round your test statistic to two decimal places and your P-value to three decimal places.)
t=24.96
P-value = 0.000
State the conclusion in the problem context. (Use a = 0.05.)
O Reject H.. There is a useful linear relationship between runoff and rainfall at the 0.05 level.
O Reject H,. There is not a useful linear relationship between runoff and rainfall at the 0.05 level.
O Fail to reject H,. There is not a useful linear relationship between runoff and rainfall at the 0.05 level.
O Fail to reject H,. There is a useful linear relationship between runoff and rainfall at the 0.05 level.
Calculate a 95% confidence interval for the true average change in runoff volume associated with a 1 m increase in rainfall volume. (Round your answers to three decimal places.)
m3
Expert Solution
This question has been solved!
Explore an expertly crafted, step-by-step solution for a thorough understanding of key concepts.

This is a popular solution!

Trending now
This is a popular solution!

Step by step
Solved in 2 steps with 2 images

Recommended textbooks for you
College Algebra
Algebra
ISBN:
9781305115545
Author:
James Stewart, Lothar Redlin, Saleem Watson
Publisher:
Cengage Learning

Functions and Change: A Modeling Approach to Coll…
Algebra
ISBN:
9781337111348
Author:
Bruce Crauder, Benny Evans, Alan Noell
Publisher:
Cengage Learning

Algebra and Trigonometry (MindTap Course List)
Algebra
ISBN:
9781305071742
Author:
James Stewart, Lothar Redlin, Saleem Watson
Publisher:
Cengage Learning
College Algebra
Algebra
ISBN:
9781305115545
Author:
James Stewart, Lothar Redlin, Saleem Watson
Publisher:
Cengage Learning
Functions and Change: A Modeling Approach to Coll…
Algebra
ISBN:
9781337111348
Author:
Bruce Crauder, Benny Evans, Alan Noell
Publisher:
Cengage Learning
Algebra and Trigonometry (MindTap Course List)
Algebra
ISBN:
9781305071742
Author:
James Stewart, Lothar Redlin, Saleem Watson
Publisher:
Cengage Learning

Algebra & Trigonometry with Analytic Geometry
Algebra
ISBN:
9781133382119
Author:
Swokowski
Publisher:
Cengage