R1.3 I'd die without my phone! In a survey of over 2000 U.S. teenagers by Harris Interactive, 47% said that "their social life would end or be worsened without their cell phone."46 One survey question asked the teens how important it is for their phone to have certain features. The following figure displays data on the percent who indicated that a particular feature is vital. 60 Percent who said vital 50 40 30 20 10 0 46% 0 Make/receive calls 39% 19% 17% 0 Send/receive Camera Send/receive text messages pictures Feature Starnes & Tabor, The Practice of Statistics, 6e, © 2018 Bedford, Freeman & Worth High School Publishers a. Explain how the graph gives a misleading impression. b. Would it be appropriate to make a pie chart to display these data? Why or why not?
R1.3 I'd die without my phone! In a survey of over 2000 U.S. teenagers by Harris Interactive, 47% said that "their social life would end or be worsened without their cell phone."46 One survey question asked the teens how important it is for their phone to have certain features. The following figure displays data on the percent who indicated that a particular feature is vital. 60 Percent who said vital 50 40 30 20 10 0 46% 0 Make/receive calls 39% 19% 17% 0 Send/receive Camera Send/receive text messages pictures Feature Starnes & Tabor, The Practice of Statistics, 6e, © 2018 Bedford, Freeman & Worth High School Publishers a. Explain how the graph gives a misleading impression. b. Would it be appropriate to make a pie chart to display these data? Why or why not?

Holt Mcdougal Larson Pre-algebra: Student Edition 2012
1st Edition
ISBN:9780547587776
Author:HOLT MCDOUGAL
Publisher:HOLT MCDOUGAL
Chapter11: Data Analysis And Probability
Section: Chapter Questions
Problem 8CR

Related questions
Question
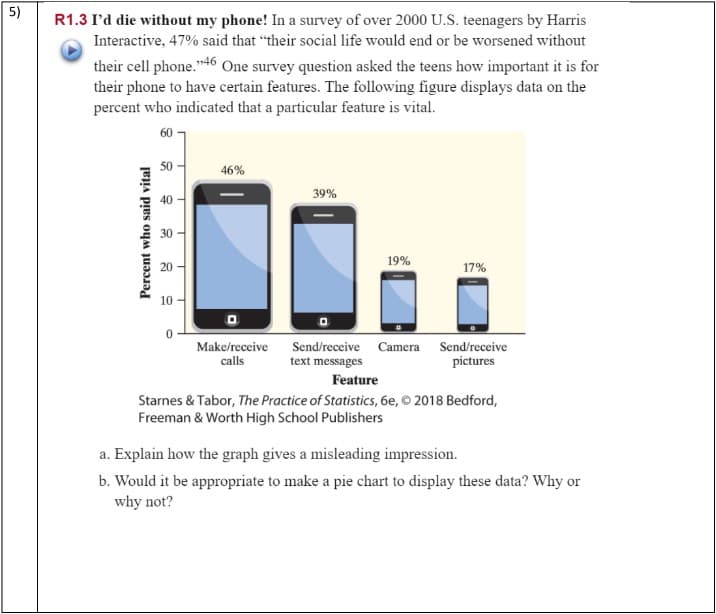
In a survey of over 2000 U.S. teenagers by Harris Interactive, 47% said that "their social life would end or be worsened without their cell phone." One survey question asked the teens how important it is for their phone to have certain features. The following figure displays data on the percent who indicated that a particular feature is vital.
a. Explain how the graph gives a misleading impression.
b. Would it be appropriate to make a pie chart to display these data? Why or why not?
Transcribed Image Text:5)
R1.3 I'd die without my phone! In a survey of over 2000 U.S. teenagers by Harris
Interactive, 47% said that "their social life would end or be worsened without
their cell phone."46 One survey question asked the teens how important it is for
their phone to have certain features. The following figure displays data on the
percent who indicated that a particular feature is vital.
60
Percent who said vital
50
40
30
20
10
0
T
T
46%
Make/receive
calls
39%
19%
17%
Send/receive Camera Send/receive
text messages
pictures
Feature
Starnes & Tabor, The Practice of Statistics, 6e, © 2018 Bedford,
Freeman & Worth High School Publishers
a. Explain how the graph gives a misleading impression.
b. Would it be appropriate to make a pie chart to display these data? Why or
why not?
Expert Solution
This question has been solved!
Explore an expertly crafted, step-by-step solution for a thorough understanding of key concepts.

This is a popular solution!

Trending now
This is a popular solution!

Step by step
Solved in 3 steps

Recommended textbooks for you
Holt Mcdougal Larson Pre-algebra: Student Edition…
Algebra
ISBN:
9780547587776
Author:
HOLT MCDOUGAL
Publisher:
HOLT MCDOUGAL
Holt Mcdougal Larson Pre-algebra: Student Edition…
Algebra
ISBN:
9780547587776
Author:
HOLT MCDOUGAL
Publisher:
HOLT MCDOUGAL