Random samples of two species of iris gave the following petal lengths (in cm). x1, Iris virginica 5.2 5.9 4.5 4.9 5.7 4.8 5.8 6.4 5.7 5.9 x2, Iris versicolor 4.5 4.9 4.7 5.0 3.8 5.1 4.4 4.2 Find the value of the chi-square statistic for the sample. (Round your answer to two decimal places.) What are the degrees of freedom? (b) Find a 90% confidence interval for the population standard deviation of x1. (Round your answers to two decimal places.) lower limit upper limit Find the value of the sample F statistic. (Round your answer to two decimal places.)


Random samples of two species of iris gave the following petal lengths (in cm).
| x1, Iris virginica | 5.2 | 5.9 | 4.5 | 4.9 | 5.7 | 4.8 | 5.8 | 6.4 | 5.7 | 5.9 |
| x2, Iris versicolor | 4.5 | 4.9 | 4.7 | 5.0 | 3.8 | 5.1 | 4.4 | 4.2 |
Find the value of the chi-square statistic for the sample. (Round your answer to two decimal places.)
What are the degrees of freedom?
(b) Find a 90% confidence interval for the population standard deviation of
(Round your answers to two decimal places.)
| lower limit | |
| upper limit |
Find the value of the sample F statistic. (Round your answer to two decimal places.)
Given data provides random samples of two species of iris gave the following petal lengths (in cm).
- Mean & standard deviation for x1, Iris virginica :
The sample size is . The provided sample data along with the data required to compute the sample mean and sample variance are shown in the table below:
| X | X2 | |
| 5.2 | 27.04 | |
| 5.9 | 34.81 | |
| 4.5 | 20.25 | |
| 4.9 | 24.01 | |
| 5.7 | 32.49 | |
| 4.8 | 23.04 | |
| 5.8 | 33.64 | |
| 6.4 | 40.96 | |
| 5.7 | 32.49 | |
| 5.9 | 34.81 | |
| Sum = | 54.8 | 303.54 |
The sample mean is computed as follows:
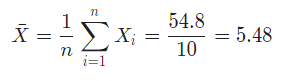
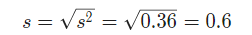
Also, the sample variance is
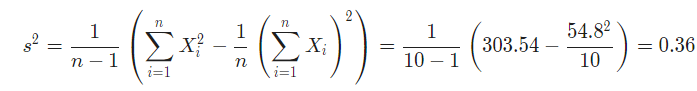
Therefore, the sample standard deviation is
- Mean & standard deviation for x2, Iris versicolor :
The sample size is . The provided sample data along with the data required to compute the sample mean and sample variance are shown in the table below:
| X | X2 | |
| 4.5 | 20.25 | |
| 4.9 | 24.01 | |
| 4.7 | 22.09 | |
| 5 | 25 | |
| 3.8 | 14.44 | |
| 5.1 | 26.01 | |
| 4.4 | 19.36 | |
| 4.2 | 17.64 | |
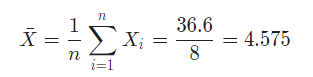
| Sum = | 36.6 | 168.8 |
The sample mean is computed as follows:
Also, the sample variance is
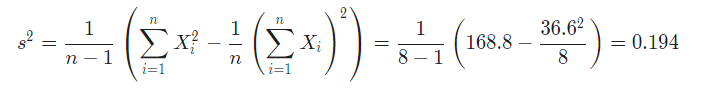
Therefore, the sample standard deviation is
The provided sample variance is and the sample size is given by .
Null and Alternative Hypotheses
The following null and alternative hypotheses need to be tested:
This corresponds to a right-tailed test, for which a Chi-Square test for one population variance will be used.
Rejection Region
Based on the information provided, the significance level is , and the the rejection region for this right-tailed test is .
Test Statistics
The Chi-Squared statistic is computed as follows:
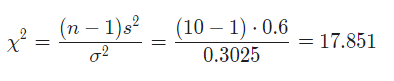
Decision about the null hypothesis
Since it is observed that , it is then concluded that the null hypothesis is rejected.
Conclusion
It is concluded that the null hypothesis Ho is rejected. Therefore, there is enough evidence to claim that the population variance is greater than 0.3025, at the 0.05 significance level.

Step by step
Solved in 4 steps with 10 images


