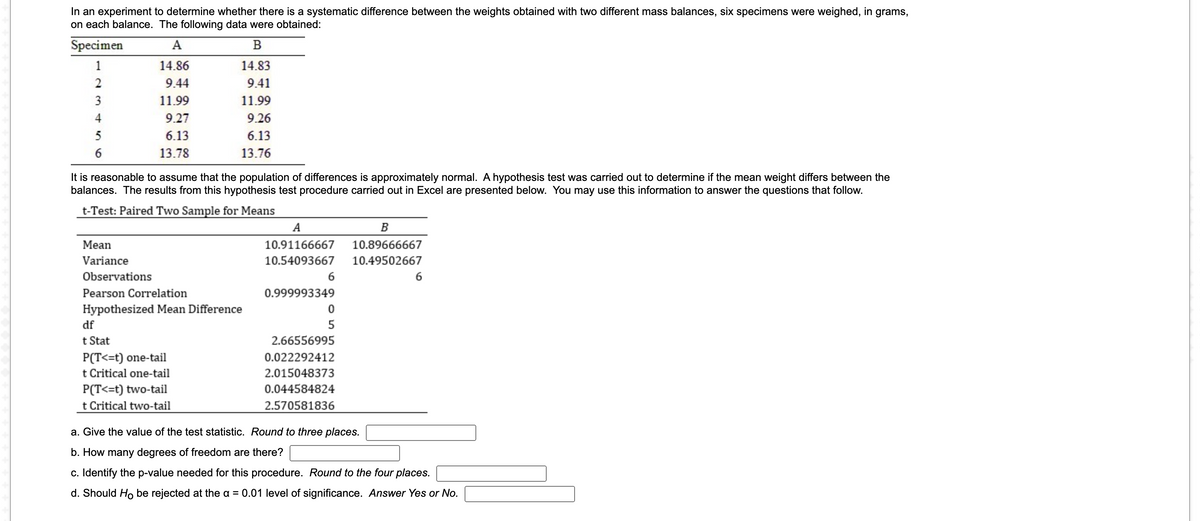
In an experiment to determine whether there is a systematic difference between the weights obtained with two different mass balances, six specimens were weighed, in grams, on each balance. The following data were obtained: Specimen A в 1 14.86 14.83 2. 9.44 9.41 3 11.99 11.99 4 9.27 9.26 5 6.13 6.13 6. 13.78 13.76 It is reasonable to assume that the population of differences is approximately normal. A hypothesis test was carried out to determine if the mean weight differs between the balances. The results from this hypothesis test procedure carried out in Excel are presented below. You may use this information to answer the questions that follow. t-Test: Paired Two Sample for Means A B Мean Variance 10.91166667 10.89666667 10.54093667 10.49502667 Observations 6. Pearson Correlation 0.999993349 Hypothesized Mean Difference df t Stat P(T<=t) one-tail t Critical one-tail P(T<=t) two-tail t Critical two-tail 2.66556995 0.022292412 2.015048373 0.044584824 2.570581836 a. Give the value of the test statistic. Round to three places. b. How many degrees of freedom are there? c. Identify the p-value needed for this procedure. Round to the four places. d. Should Ho be rejected at the a = 0.01 level of significance. Answer Yes or No.
In an experiment to determine whether there is a systematic difference between the weights obtained with two different mass balances, six specimens were weighed, in grams, on each balance. The following data were obtained: Specimen A в 1 14.86 14.83 2. 9.44 9.41 3 11.99 11.99 4 9.27 9.26 5 6.13 6.13 6. 13.78 13.76 It is reasonable to assume that the population of differences is approximately normal. A hypothesis test was carried out to determine if the mean weight differs between the balances. The results from this hypothesis test procedure carried out in Excel are presented below. You may use this information to answer the questions that follow. t-Test: Paired Two Sample for Means A B Мean Variance 10.91166667 10.89666667 10.54093667 10.49502667 Observations 6. Pearson Correlation 0.999993349 Hypothesized Mean Difference df t Stat P(T<=t) one-tail t Critical one-tail P(T<=t) two-tail t Critical two-tail 2.66556995 0.022292412 2.015048373 0.044584824 2.570581836 a. Give the value of the test statistic. Round to three places. b. How many degrees of freedom are there? c. Identify the p-value needed for this procedure. Round to the four places. d. Should Ho be rejected at the a = 0.01 level of significance. Answer Yes or No.

MATLAB: An Introduction with Applications
6th Edition
ISBN:9781119256830
Author:Amos Gilat
Publisher:Amos Gilat
Chapter1: Starting With Matlab
Section: Chapter Questions
Problem 1P

Related questions
Question
Transcribed Image Text:In an experiment to determine whether there is a systematic difference between the weights obtained with two different mass balances, six specimens were weighed, in grams,
on each balance. The following data were obtained:
Specimen
A
1
14.86
14.83
2
9.44
9.41
3
11.99
11.99
4
9.27
9.26
5
6.13
6.13
13.78
13.76
It is reasonable to assume that the population of differences is approximately normal. A hypothesis test was carried out to determine if the mean weight differs between the
balances. The results from this hypothesis test procedure carried out in Excel are presented below. You may use this information to answer the questions that follow.
t-Test: Paired Two Sample for Means
A
B
Mean
10.91166667
10.89666667
Variance
10.54093667
10.49502667
Observations
6
6
Pearson Correlation
0.999993349
Hypothesized Mean Difference
df
5
t Stat
2.66556995
P(T<=t) one-tail
0.022292412
t Critical one-tail
2.015048373
P(T<=t) two-tail
t Critical two-tail
0.044584824
2.570581836
a. Give the value of the test statistic. Round to three places.
b. How many degrees of freedom are there?
c. Identify the p-value needed for this procedure. Round to the four places.
d. Should Ho be rejected at the a = 0.01 level of significance. Answer Yes or No.
Expert Solution
This question has been solved!
Explore an expertly crafted, step-by-step solution for a thorough understanding of key concepts.

This is a popular solution!

Trending now
This is a popular solution!

Step by step
Solved in 2 steps with 1 images

Recommended textbooks for you
MATLAB: An Introduction with Applications
Statistics
ISBN:
9781119256830
Author:
Amos Gilat
Publisher:
John Wiley & Sons Inc

Probability and Statistics for Engineering and th…
Statistics
ISBN:
9781305251809
Author:
Jay L. Devore
Publisher:
Cengage Learning

Statistics for The Behavioral Sciences (MindTap C…
Statistics
ISBN:
9781305504912
Author:
Frederick J Gravetter, Larry B. Wallnau
Publisher:
Cengage Learning
MATLAB: An Introduction with Applications
Statistics
ISBN:
9781119256830
Author:
Amos Gilat
Publisher:
John Wiley & Sons Inc
Probability and Statistics for Engineering and th…
Statistics
ISBN:
9781305251809
Author:
Jay L. Devore
Publisher:
Cengage Learning
Statistics for The Behavioral Sciences (MindTap C…
Statistics
ISBN:
9781305504912
Author:
Frederick J Gravetter, Larry B. Wallnau
Publisher:
Cengage Learning

Elementary Statistics: Picturing the World (7th E…
Statistics
ISBN:
9780134683416
Author:
Ron Larson, Betsy Farber
Publisher:
PEARSON

The Basic Practice of Statistics
Statistics
ISBN:
9781319042578
Author:
David S. Moore, William I. Notz, Michael A. Fligner
Publisher:
W. H. Freeman

Introduction to the Practice of Statistics
Statistics
ISBN:
9781319013387
Author:
David S. Moore, George P. McCabe, Bruce A. Craig
Publisher:
W. H. Freeman