Randomly selected deaths of motoroycle ridera in a region of the northern hemisphere are summarized in the accompanying table Use a0.05 signficance level to test the claim that such fatalities occur with equal frequency in the different months How might the results be explained? Month Jan Feb March Apri 13 May 21 Nov 12 June o 30 Dec Number 11 15 Oct. 12 Month July 26 Aug 26 Sept. 24 Number Determine the null and alternative hypotheses H Calculate the test statistic, y. x (Round to three decimal places as needed.) Calculate the P.value. P.value (Round to three decimal places as needed.) wWhat is the conclusion for this hypothesis tosr? in tn ealant un answerisi. What is the conclusion for this hypothesis test? Because the Pvalue is the significance level, H There suffcient evidence to warrant rejection of the claim that motoreyce fatalities occur with equal frequency in the different months How might the results be explained? O A. People are more likely to drive motorcycles during the summer, and less lkely during the winter OB. People are more likely to drive motorcycles during the spring, nd less likely during fal. OC. People are equally likely to drive motorcycles at any time of the year. O D. People are less likely to drive motorcycles during the summer, and more likely during the winter.
Randomly selected deaths of motoroycle ridera in a region of the northern hemisphere are summarized in the accompanying table Use a0.05 signficance level to test the claim that such fatalities occur with equal frequency in the different months How might the results be explained? Month Jan Feb March Apri 13 May 21 Nov 12 June o 30 Dec Number 11 15 Oct. 12 Month July 26 Aug 26 Sept. 24 Number Determine the null and alternative hypotheses H Calculate the test statistic, y. x (Round to three decimal places as needed.) Calculate the P.value. P.value (Round to three decimal places as needed.) wWhat is the conclusion for this hypothesis tosr? in tn ealant un answerisi. What is the conclusion for this hypothesis test? Because the Pvalue is the significance level, H There suffcient evidence to warrant rejection of the claim that motoreyce fatalities occur with equal frequency in the different months How might the results be explained? O A. People are more likely to drive motorcycles during the summer, and less lkely during the winter OB. People are more likely to drive motorcycles during the spring, nd less likely during fal. OC. People are equally likely to drive motorcycles at any time of the year. O D. People are less likely to drive motorcycles during the summer, and more likely during the winter.

College Algebra (MindTap Course List)
12th Edition
ISBN:9781305652231
Author:R. David Gustafson, Jeff Hughes
Publisher:R. David Gustafson, Jeff Hughes
Chapter8: Sequences, Series, And Probability
Section8.7: Probability
Problem 58E: What is meant by the sample space of an experiment?

Related questions
Question
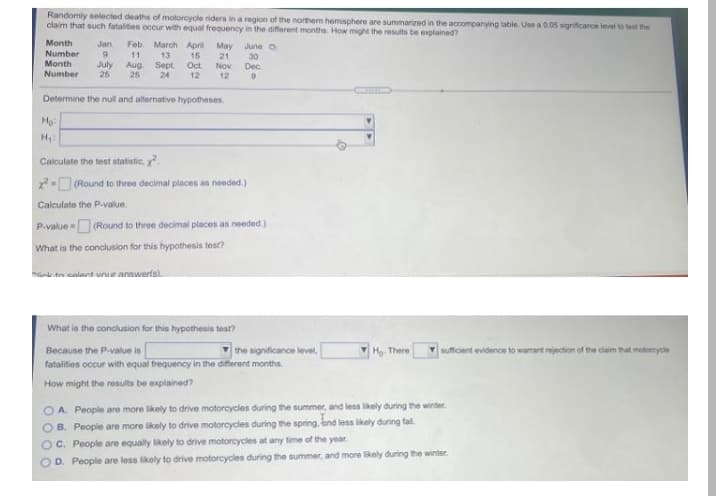
Transcribed Image Text:Randomly selected deaths of motorcycle ridera in a region of the northern hemisphere are summarized in the accompanying table. Use a 0.05 significance level to test the
claim that such fatalities occur with equal frequency in the different months. How might the results be explained?
Month
Number
Feb. March April May June o
Jan
11
13
15
Oct
12
21
Month
Number
July
26
Aug
25
30
Dec
Sept.
Nov.
12
24
Determine the nul and alternative hypotheses
Họ
H
Calculate the test statistic, .
x (Round to three decimal places as needed.)
Calculate the P.value.
P.value (Round to three decimal places as needed.)
What is the conclusion for this hypothesis test?
in tn calant urr answerlsi.
What is the conclusion for this hypothesis test?
suffcient evidenoe to warant rejection of the claim that motoreycde
V the significance level,
fatalities occur with equal frequency in the different months
Because the P-value is
H There
How might the results be explained?
O A. People are more likely to drive motorcycles during the summer, and less lkely during the winter
OB. People are more likely to drive motorcycles during the spring, and less likely during fal.
OC. People are equally likely to drive motorcycles at any time of the year.
O D. People are less likely to drive motorcycles during the summer, and more likely during the winter.
Expert Solution
This question has been solved!
Explore an expertly crafted, step-by-step solution for a thorough understanding of key concepts.

Step by step
Solved in 4 steps with 4 images

Knowledge Booster


Learn more about
Need a deep-dive on the concept behind this application? Look no further. Learn more about this topic, statistics and related others by exploring similar questions and additional content below.Recommended textbooks for you
College Algebra (MindTap Course List)
Algebra
ISBN:
9781305652231
Author:
R. David Gustafson, Jeff Hughes
Publisher:
Cengage Learning
College Algebra (MindTap Course List)
Algebra
ISBN:
9781305652231
Author:
R. David Gustafson, Jeff Hughes
Publisher:
Cengage Learning