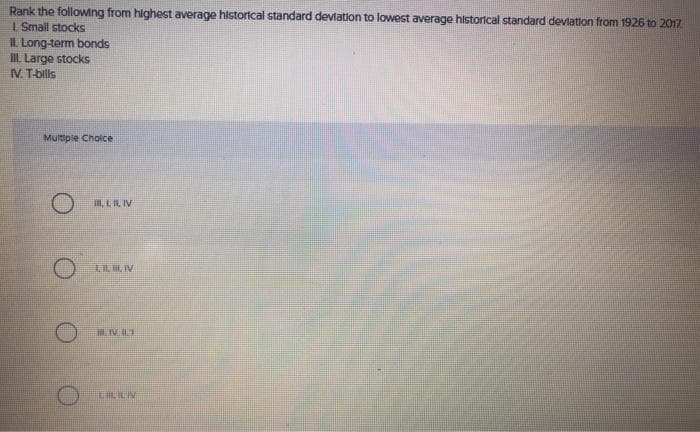
Rank the following from highest average historical standard devlation to lowest average historical standard devlation from 1926 to 2017 I Small stockS IL. Long-term bonds IL. Large stocks IV. T-bills


Q: Data table (Click on the following icon in order to copy its contents into a spreadsheet.)…
A: Portfolio standard deviation represents the risk or volatility of the portfolio. It gives the…
Q: Among the following types of investments, small-company stocks, large-company stocks, long-term…
A: An investor can invest in different types of securities which can be risky or risk-free. The…
Q: Use the following table: Series Large stocks Small stocks Average return 11.88 % 16.58 6.29…
A: Return on Portfolio = (W1 x Average Return on S1)+ (W2 x Average Return S2)
Q: Rank the following from highest average historical standard deviation to lowest average historical…
A: Standard deviation is the measure of deviation of returns from the average returns. Standard…
Q: Compare and contrast the following: A. Primary and secondary financial markets.
A: “Hi There, Thanks for posting the questions. As per our Q&A guidelines, must be answered only…
Q: Which one of the following is a correct ranking of securities based on their volatility over a very…
A: Volatility refers to vulnerability of the security market prices to fluctuate. In case, a security…
Q: James Peterson has gathered the following information of 5 exchange-traded funds (ETFS). The…
A: Since you have posted a question with multiple sub-parts, we will solve first three subparts for…
Q: Use the following table: Series Average return Large stocks 11.76 % Small stocks 16.46…
A: The return of portfolio can be calculated as expected return of the portfolio. The expected return…
Q: What is the standard deviation of Stock A returns given the information below about its returns…
A: Solution:- Standard deviation means the deviation of a value around its mean. Standard deviation in…
Q: A price-weighted index comprises of 3 stocks A, B, and C. The beginning of year prices of 3 stocks…
A: Since you have provided two different snips with two different questions, it possible to solve to…
Q: bonds
A: Investment options are of various types. Some investments carry higher risks while some would carry…
Q: Consider the following information on large-company stocks for a period of years. Arithmetic…
A: Real Return = [(1+nominal) /(1+inflation)]-1
Q: n the formula ke >= (D1/P0) + g, what does (D1/P0) represent? Select one: a. The expected…
A: ke = Required return D1=Expected dividend P0=Current price g = Growth rate
Q: In a year in which corporate bonds offered an average return of 9%, treasury bonds offered an…
A: Market risk premium is the difference between the expected return of the stock and the risk free…
Q: James Peterson has gathered the following information of 5 exchange-traded funds (ETFS). The…
A: total return =p2+dp1-1 where, p2= price at year 2 p1 = price at year 1 d= dividend therefore,…
Q: Which asset class has the highest average historical returns and also the highest risk as measured…
A: The investor should choose the investment based on her/his needs, if an investor wants to take less…
Q: Over the period of 1926-2017, which one of the following had the highest volatility of returns? U.S.…
A: Of all the investmenst, i,e long and short bonds, shares, small company stock are more volatile as…
Q: Assume that over the last several decades, the annual returns on large-company common stocks…
A: Excess return earned by long-term government bonds = (long-term government bonds -U.S. T-bills)…
Q: The following table shows the nominal returns on Brazilian stocks and the rate of inflation. Nominal…
A: Part (a)Approach:As a first step we will calculate of mean of nominal returns.We then proceed to…
Q: Of the investments listed in the table below, which will give you the highest holding period return?…
A: A return that is earned by holding a security from starting to a specific time period is term as the…
Q: Use the following data for the Sara Company to calculate the cost of common stocks (Rs), the cost of…
A: given, Rf=7% Rm=25% beta=1.5 according to CAPM model: Rs=rf+beta×rm-rf=7%+1.5×25%-7%=34% answer: The…
Q: ne of the most important features of a stock is its book value. The book value per share of…
A: EPS is the amount of earnings given to the shareholders for holding one share. It is computed from…
Q: Over a certain period, large-company stocks had an average return of 12.79 percent, the average…
A: Given, Risk-free rate = 2.62% Return on given stock = 17.61% Risk premium = Return on given stock -…
Q: The following information relates to the prices and dividends of two stocks listed on the Ghana…
A:
Q: What is the answer for these? and how do we find them k. Return on common stockholders' equity % %…
A: Return on common stockholders' equity is the measure of profitability of the business available to…
Q: Use the following data for the Sara Company to calculate the cost of common stocks (Rs), the cost of…
A: The cost of Preferred stocks = (Dividend + Floatation cost) / Price of Preferred stock The cost of…
Q: Suppose that the index model for stocks A and Bis estimated from excess returns with the following…
A: Covariance shows the relationship of two variables whenever there is a change in one variable.…
Q: Assume these were the Inflation rates and U.S. stock market and Treasury bill returns between 1929…
A: “Since you have posted a question with multiple sub-parts, we will solve first three subparts for…
Q: (Quantitative Question) Consider the following average annual returns: Investment Average Return…
A: Excess of average return is the excess return over the risk free rate. Average return of treasury…
Q: Demonstrate the impact of different values on a market value weighted stock index with a…
A: Market value is the market value of stocks but for those stocks only which are the outstanding…
Q: Rank the following categories of securities in terms of their overall volatility, in order from…
A: The question is based on the concept Volatility, which is measured in terms of standard deviation or…
Q: Question 1 • An analyst has gathered P/E information on two stocks, Firm A and Form B. Market Data…
A: Firm A:Firm A has a trailing PE of 10, lower than the trailing PE of peers. Also, its Leading PE of…
Q: Which one of the following categories has the widest frequency distribution of returns for the…
A: Statement of return and SD for the period 1926 to 2008: Particulars Return % SD % Small company…
Q: Rank the following from highest average historical return to lowest average historical return from…
A: Answer: 1, 3, 2, 4
Q: Compare and contrast the following: A. Dow Jones Industrial Average and S&P 500 as stock market…
A: Dow Jones Industrial Average and S&P 500 are the stock market indices used to show the stock…
Q: Risk Premiums. Here are rates of return on a broad stock market index between 2013 and 2017:…
A: Given information: In the question, stock market return and risk free return (Return in T-Bills) for…
Q: You are given the following information regarding four stocks in a portfolio: Company # of Shares…
A: The Price Weighted Index: While constructing the price-weighted index, the average prices of the…
Q: Calculate the observed risk premium in each year for the large-company stocks versus the T-bills.…
A: Risk premium: The risk premium is the excess return that is expected on the investment over and…
Q: Over the period of 1926-2014, which one of the following investment classes had the highest…
A: Volatility is also called risk. Higher the risk and higher the return. The stock which has lass…
Q: Which of the following regarding the stock indices is true? O A. The divisor for Dow Jones…
A: Disclaimer:-Since you have asked multiple question, we will solve the first question for you. If you…
Q: Which one of the following is the most apt to have the largest risk premium in the future based on…
A: Risk premium is the difference between the market rate and risk free rate. It is the extra amount…
Q: Write a two to three sentence description of: a)Vanguard Total (US) Stock Market ETF b)Vanguard…
A: ETFs are exchange traded funds. They tend to replicate a particular index.


Trending now
This is a popular solution!

Step by step
Solved in 2 steps


- Rank the following from highest average historical return to lowest average historical return from 1926-2006. Small stocks Long term bonds Large stocks T-bills Group of answer choices 1, 2, 3, 4 3, 4, 2, 1 1, 3, 2, 4 3, 1, 2, 4 4, 2, 3, 1Rank the following from highest average historical standard deviation to lowest average historical standard deviation from 1926-2006. Small stocks Long term bonds Large stocks T-bills Group of answer choices 1, 2, 3, 4 3, 4, 2, 1 1, 3, 2, 4 3, 1, 2, 4 4, 2, 3, 1Which one of the following categories has the widest frequency distribution of returns for the period 1926-2014? Multiple Choice Small-company stocks U.S. Treasury bills Long-term government bonds Inflation Large-company stock
- The following return series comes from Global Financial Data. Year Large Stocks LT Gov Bonds US T-bills CPI (Rf asset) (inflation) 2017 21.83% 6.24% 0.80% 2.07% 2018 -5.28% -1.25% 1.81% 2.10% 2019 25.45% 3.35% 2.15% 1.10% 2020 18.16% 10.25% 4.50% 1.88% 2021 28.70% -1.54% 0.40% 7.00% 2022 -19.78% -8.55% 2.20% 6.50% Calculate the average real risk premium earned on large-company stocks using the approximate Fisher equation. (Enter percentages as decimals and round to 4 decimals)The following return series comes from Global Financial Data. Year Large Stocks LT Gov Bonds US T-bills CPI (Rf asset) (inflation) 2017 21.83% 6.24% 0.80% 2.07% 2018 -5.28% -1.25% 1.81% 2.10% 2019 25.45% 3.35% 2.15% 1.10% 2020 18.16% 10.25% 4.50% 1.88% 2021 28.70% -1.54% 0.40% 7.00% 2022 -19.78% -8.55% 2.20% 6.50% Calculate the average nominal return earned on large-company stocks. (Enter percentages as decimals and round to 4 decimals)Annual and Average Returns for Stocks, Bonds, and T-Bills, 1950 to 2017 Stocks Long-Term Treasury Bonds T-bills 1950 to 2017 Average 12.7 % 6.6 % 4.30 % 1950 to 1959 Average 20.9 0.0 2.00 1960 to 1969 Average 8.7 1.6 4.00 1970 to 1979 Average 7.5 5.7 6.30 1980 to 1989 Average 18.2 13.5 8.90 1990 to 1999 Average 19.0 9.5 4.90 2000 to 2009 Average 0.9 8.0 2.70 2010 Annual Return 15.1 9.4 0.01 2011 Annual Return 2.1 29.9 0.02 2012 Annual Return 16.0 3.6 0.02 2013 Annual Return 32.4 −12.7 0.07 2014 Annual Return 13.7 25.1 0.05 2015 Annual Return 1.4 −1.2 0.21 2016 Annual Return 12.0 1.2 0.51 2017 Annual Return 21.8 8.4 1.39 2010 to 2017 Average 14.3 8.0 0.29 You have a portfolio with an asset allocation of 50 percent stocks, 38 percent long-term Treasury bonds, and 12 percent T-bills. Use these weights and the returns given in the…
- Over the period of 1926-2014, which one of the following investment classes had the highest volatility of returns? Multiple Choice Large-company stocks U.S. Treasury bills Small-company stocks Long-term corporate bonds Long-term government bondsThe average risk premium on large-company stocks for the period 1926-2018 was: Multiple Choice 6.7% 8.3% 8.5% 12.3%Assume these are the stock market and Treasury bill returns for a 5-year period in the attached image: A. What was the risk premium on common stock in each year? (Do not round intermediate calculations. Enter your answers as a percent rounded to 2 decimal places.) Risk Premium 2013 % 2014 % 2015 % 2016 % 2017 % b. What was the average risk premium? (Do not round intermediate calculations. Enter your answer as a percent rounded to 2 decimal places.) c. What was the standard deviation of the risk premium? (Ignore that the estimation is from a sample of data.) (Do not round intermediate calculations. Enter your answer as a percent rounded to 2 decimal places.)
- Annual and Average Returns for Stocks, Bonds, and T-Bills, 1950 to 2019 Stocks Long - Term Treasury Bonds T-bills 1950 to 2019 Average 12.7% 6.6% 4.2% 1950 to 1959 Average20.9 0.0 2.0 1960 to 1969 Average 8.7 1.6 4.0 1970 to 1979 Average 7.5 5.7 6.3 1980 to 1989 Average18.2 13.5 8.9 1990 to 1999 Average 19.0 9.5 4.9 2000 to 2009 Average 0.9 8.0 2.7 2010 Annual Return15.1 9.4 0.01 2011 Annual Return 2.1 29.9 0.02 2012 Annual Return 16.0 3.6 0.02 2013 Annual Return32.4-12.7 0.07 2014 Annual Return 13.7 25.10.05 2015 Annual Return 1.4-1.2 0.21 2016 AnnualReturn 12.0 1.2 0.51 2017 Annual Return 21.8 8.4 1.39 2018 Annual Return -4.4 1.8 1.94 2019 Annual Return 31.5 14.8 2.06 2010 to 2019 Average 14.2 7.7 0.63 You have a portfolio with an asset allocation of 62 percent stocks, 30 percent long-term Treasury bonds, and 8 percent T-bills. Use these weights and the returns given in the above table to compute the return of the portfolio in the year 2010 and each year since. Then compute the…Assume these are the stock market and Treasury bill returns for a 5-year period: Year Stock Market Return (%) T-Bill Return (%) 2013 35.90 0.21 2014 15.20 0.21 2015 -5.10 0.21 2016 16.90 0.08 2017 25.90 0.10 a. What was the risk premium on common stock in each year? (Do not round intermediate calculations. Enter your answers as a percent rounded to 2 decimal places.) Year Risk Premium 2013 % 2014 % 2015 % 2016 % 2017 % b. What was the average risk premium? (Do not round intermediate calculations. Enter your answer as a percent rounded to 2 decimal places.) c. What was the standard deviation of the risk premium? (Ignore that the estimation is from a sample of data.) (Do not round intermediate calculations. Enter your answer as a percent rounded to 2 decimal places.)Assume these are the stock market and Treasury bill returns for a 5-year period: Year Stock Market Return (%) T-Bill Return (%) 2016 13.0 0.2 2017 21.0 0.8 2018 -6.2 1.8 2019 29.8 2.1 2020 20.6 0.4 Required: What was the risk premium on common stock in each year? What was the average risk premium? What was the standard deviation of the risk premium? (Ignore that the estimation is from a sample of data.)-- expressed in % (NOTE: 11.31% is incorrect)
