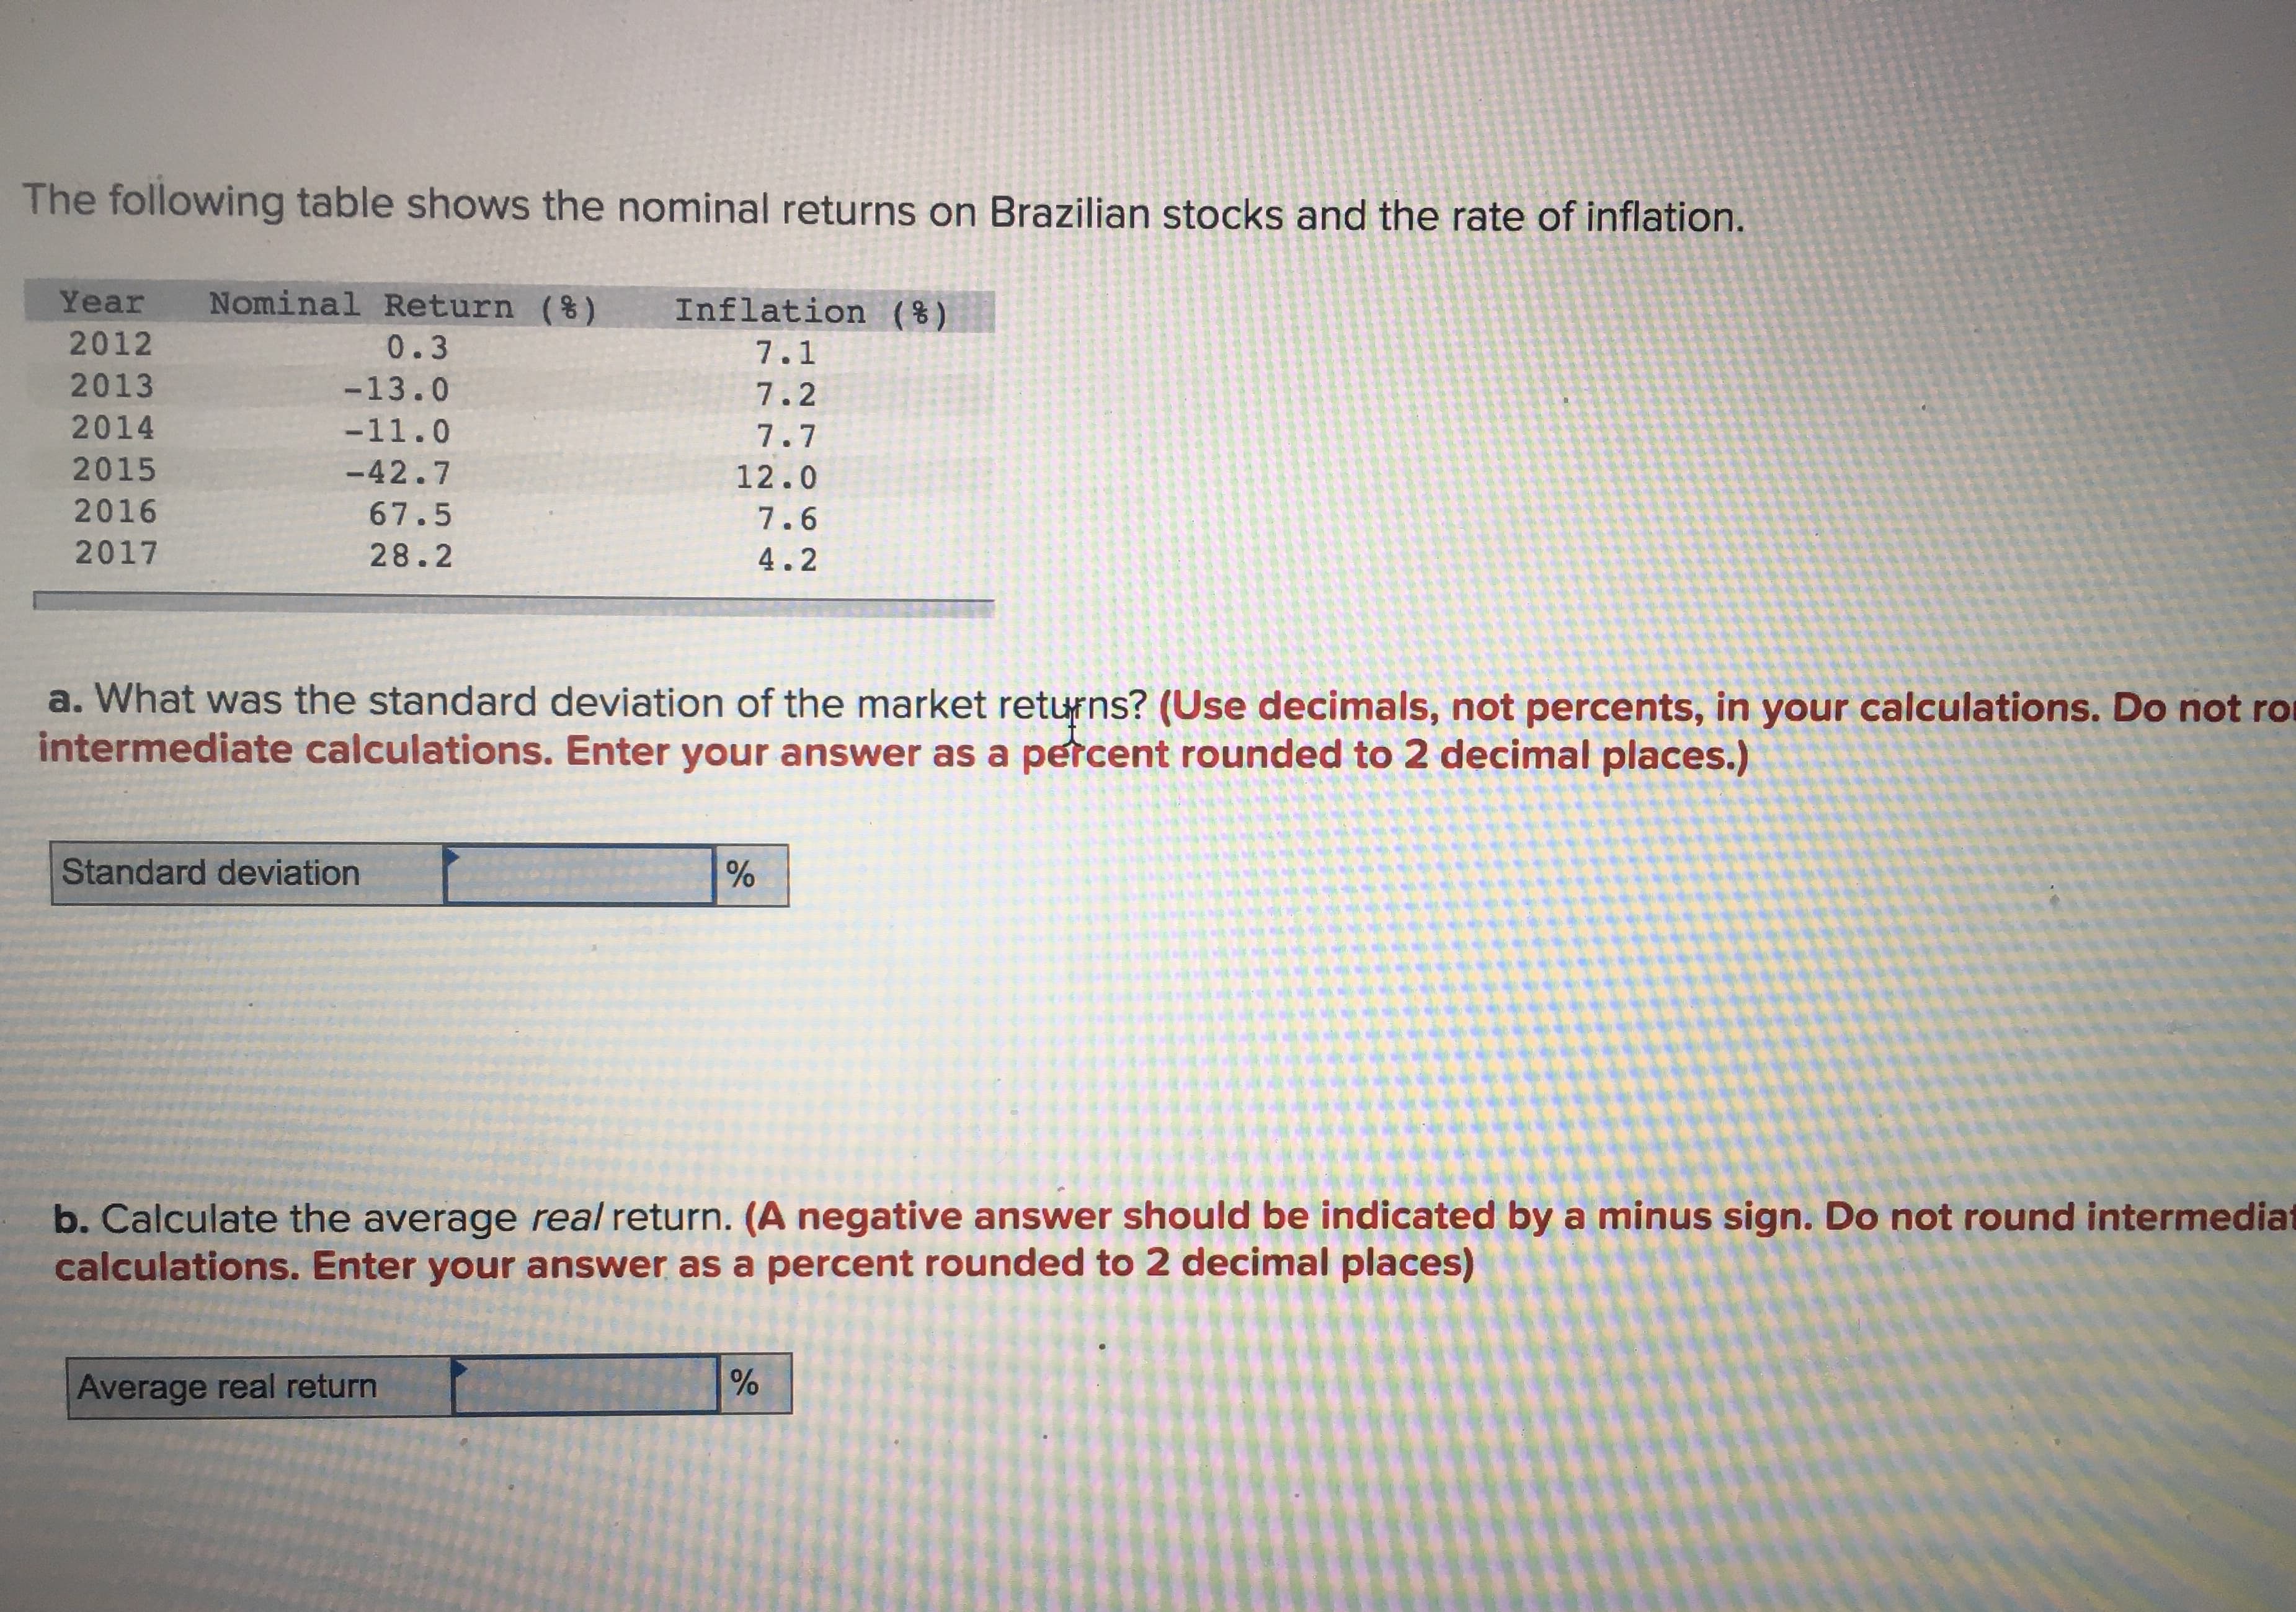
The following table shows the nominal returns on Brazilian stocks and the rate of inflation. Nominal Return (%) Year Inflation (%) 2012 0.3 7.1 2013 -13.0 7.2 2014 -11.0 7.7 2015 -42.7 12.0 2016 67.5 7.6 2017 28.2 4.2 a. What was the standard deviation of the market retuns? (Use decimals, not percents, in your calculations. Do not ro intermediate calculations. Enter your answer as a percent rounded to 2 decimal places.) Standard deviation b. Calculate the average real return. (A negative answer should be indicated by a minus sign. Do not round intermediat calculations. Enter your answer as a percent rounded to 2 decimal places) Average real return
The following table shows the nominal returns on Brazilian stocks and the rate of inflation. Nominal Return (%) Year Inflation (%) 2012 0.3 7.1 2013 -13.0 7.2 2014 -11.0 7.7 2015 -42.7 12.0 2016 67.5 7.6 2017 28.2 4.2 a. What was the standard deviation of the market retuns? (Use decimals, not percents, in your calculations. Do not ro intermediate calculations. Enter your answer as a percent rounded to 2 decimal places.) Standard deviation b. Calculate the average real return. (A negative answer should be indicated by a minus sign. Do not round intermediat calculations. Enter your answer as a percent rounded to 2 decimal places) Average real return

Chapter10: Measuring Exposure To Exchange Rate Fluctuations
Section: Chapter Questions
Problem 41QA

Related questions
Question
Transcribed Image Text:The following table shows the nominal returns on Brazilian stocks and the rate of inflation.
Nominal Return (%)
Year
Inflation (%)
2012
0.3
7.1
2013
-13.0
7.2
2014
-11.0
7.7
2015
-42.7
12.0
2016
67.5
7.6
2017
28.2
4.2
a. What was the standard deviation of the market retuns? (Use decimals, not percents, in your calculations. Do not ro
intermediate calculations. Enter your answer as a percent rounded to 2 decimal places.)
Standard deviation
b. Calculate the average real return. (A negative answer should be indicated by a minus sign. Do not round intermediat
calculations. Enter your answer as a percent rounded to 2 decimal places)
Average real return
Expert Solution
This question has been solved!
Explore an expertly crafted, step-by-step solution for a thorough understanding of key concepts.

This is a popular solution!

Trending now
This is a popular solution!

Step by step
Solved in 6 steps with 2 images

Recommended textbooks for you