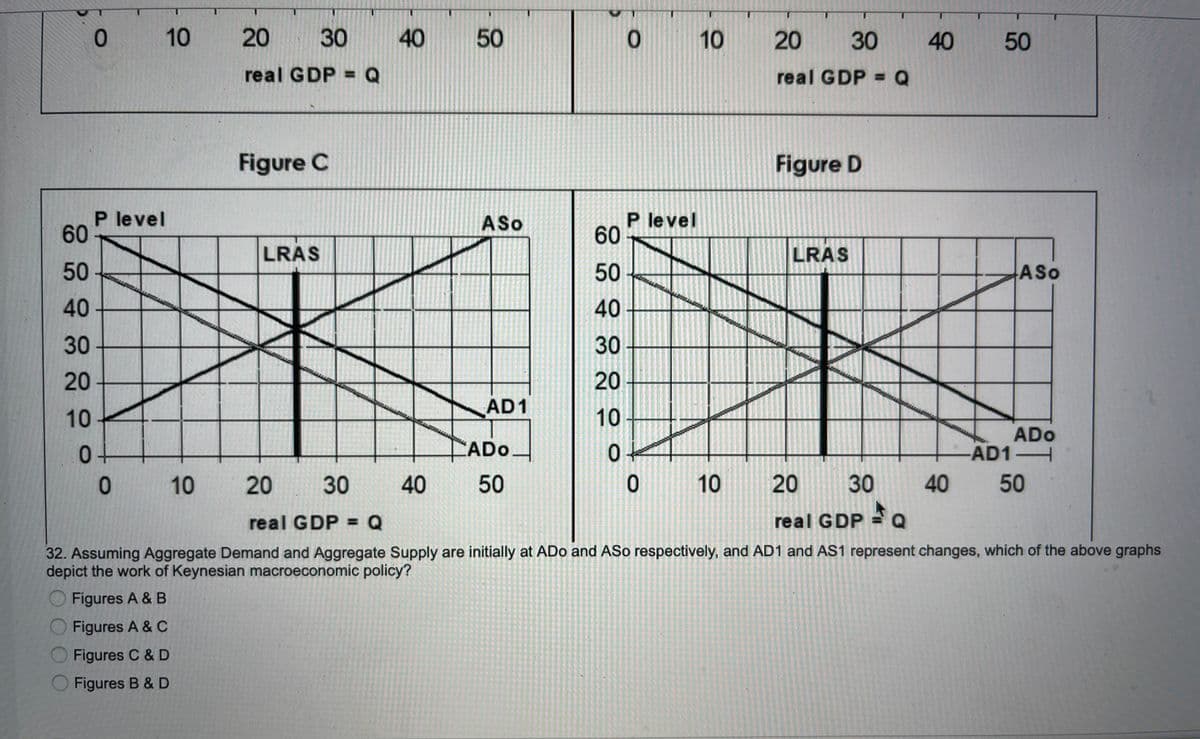
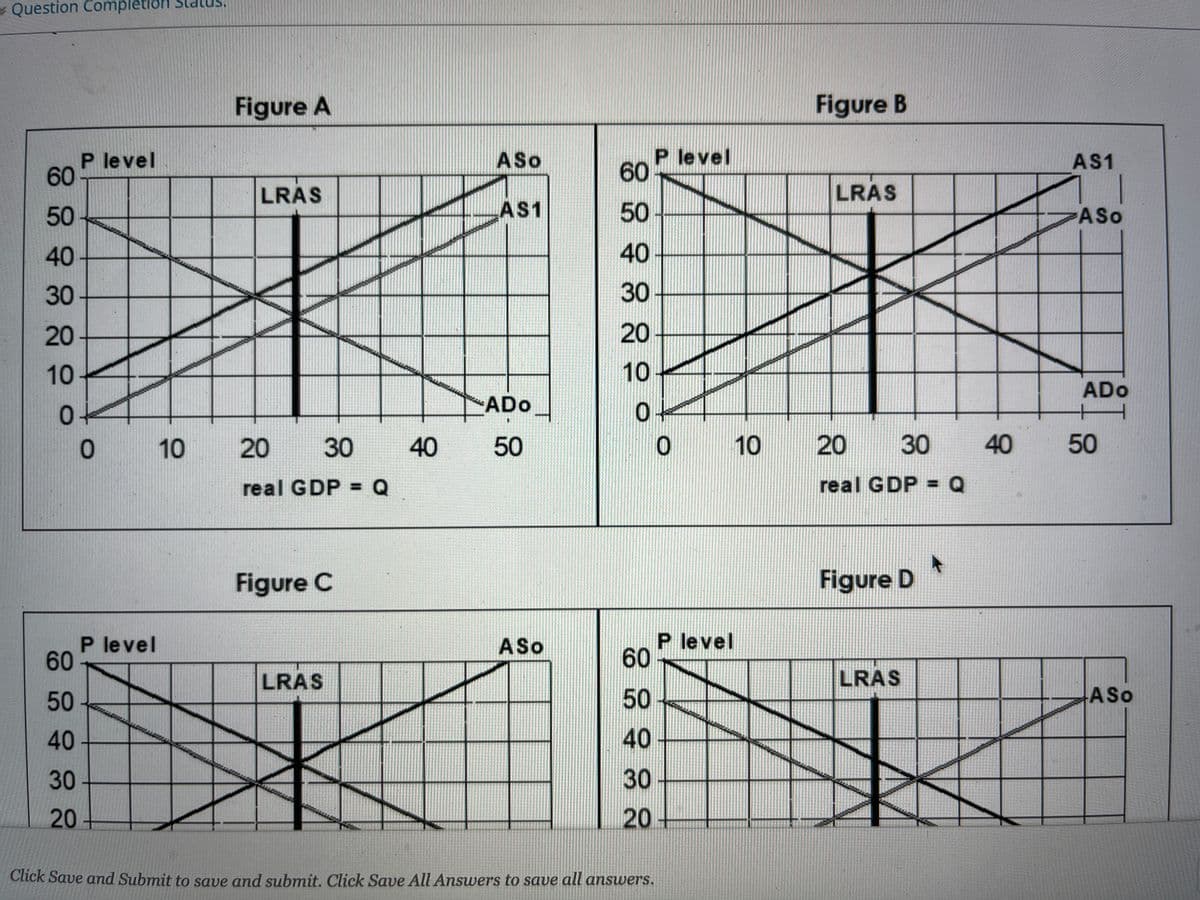
Figure C Figure D P level 60 P level 60 ASo LRAS LRAS 50 50 ASo 40 40 30 30 20 20 AD1 10 10 ADo AD1H CADO 10 20 30 40 50 10 20 30 40 50 real GDP = Q real GDP = Q 32. Assuming Aggregate Demand and Aggregate Supply are initially at ADo and ASo respectively, and AD1 and AS1 represent changes, which of the above graphs depict the work of Keynesian macroeconomic policy? O Figures A &B O Figures A & C Figures C & D O Figures B &D
Figure C Figure D P level 60 P level 60 ASo LRAS LRAS 50 50 ASo 40 40 30 30 20 20 AD1 10 10 ADo AD1H CADO 10 20 30 40 50 10 20 30 40 50 real GDP = Q real GDP = Q 32. Assuming Aggregate Demand and Aggregate Supply are initially at ADo and ASo respectively, and AD1 and AS1 represent changes, which of the above graphs depict the work of Keynesian macroeconomic policy? O Figures A &B O Figures A & C Figures C & D O Figures B &D

Managerial Economics: Applications, Strategies and Tactics (MindTap Course List)
14th Edition
ISBN:9781305506381
Author:James R. McGuigan, R. Charles Moyer, Frederick H.deB. Harris
Publisher:James R. McGuigan, R. Charles Moyer, Frederick H.deB. Harris
Chapter11: Price And Output Determination: Monopoly And Dominant Firms
Section: Chapter Questions
Problem 1E

Related questions
Question
Transcribed Image Text:10
20
30
40
50
10
20
30
40
real GDP = Q
real GDP = Q
Figure C
Figure D
P level
60
P level
60
ASo
LRAS
LRAS
50
50
ASo
40
40
30
30 +
20
20
10
AD1
10
CADO.
ADo
AD1H
20
30
50
10
20
30
40
50
real GDP = Q
real GDP
32. Assuming Aggregate Demand and Aggregate Supply are initially at ADo and ASo respectively, and AD1 and AS1 represent changes, which of the above graphs
depict the work of Keynesian macroeconomic policy?
Figures A & B
Figures A & C
Figures C & D
Figures B & D
50
40
10
Transcribed Image Text:Question Complètion
Figure A
Figure B
P level
60
P level
60
ASo
AS1
LRAS
LRAS
50
AS1
50
ASo
40
40
30
30
20
20
10
10
ADo
ADo
10
20
30
40
50
10
20
30
40
50
real GDP = Q
real GDP = Q
%3D
%3D
Figure C
Figure D
P level
60
P level
60
ASo
LRAS
LRAS
50
50
ASo
40
40
30
30
20
20+
Click Save and Submit to save and submit. Click Save All Answers to save all answers.
Expert Solution
This question has been solved!
Explore an expertly crafted, step-by-step solution for a thorough understanding of key concepts.

This is a popular solution!

Trending now
This is a popular solution!

Step by step
Solved in 2 steps

Knowledge Booster


Learn more about
Need a deep-dive on the concept behind this application? Look no further. Learn more about this topic, economics and related others by exploring similar questions and additional content below.Recommended textbooks for you
Managerial Economics: Applications, Strategies an…
Economics
ISBN:
9781305506381
Author:
James R. McGuigan, R. Charles Moyer, Frederick H.deB. Harris
Publisher:
Cengage Learning
Managerial Economics: Applications, Strategies an…
Economics
ISBN:
9781305506381
Author:
James R. McGuigan, R. Charles Moyer, Frederick H.deB. Harris
Publisher:
Cengage Learning